

| << Chapter < Page | Chapter >> Page > |
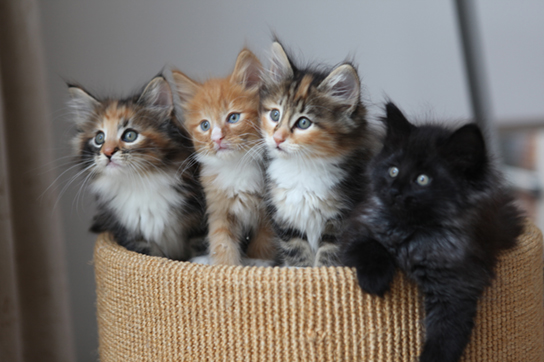
Individuals of a population often display different phenotypes, or express different alleles of a particular gene, referred to as polymorphisms. Populations with two or more variations of particular characteristics are called polymorphic. The distribution of phenotypes among individuals, known as the population variation , is influenced by a number of factors, including the population’s genetic structure and the environment ( [link] ). Understanding the sources of a phenotypic variation in a population is important for determining how a population will evolve in response to different evolutionary pressures.
Natural selection and some of the other evolutionary forces can only act on heritable traits, namely an organism’s genetic code. Because alleles are passed from parent to offspring, those that confer beneficial traits or behaviors may be selected for, while deleterious alleles may be selected against. Acquired traits, for the most part, are not heritable. For example, if an athlete works out in the gym every day, building up muscle strength, the athlete’s offspring will not necessarily grow up to be a body builder. If there is a genetic basis for the ability to run fast, on the other hand, this may be passed to a child.
Before Darwinian evolution became the prevailing theory of the field, French naturalist Jean-Baptiste Lamarck theorized that acquired traits could, in fact, be inherited; while this hypothesis has largely been unsupported, scientists have recently begun to realize that Lamarck was not completely wrong. Visit this site to learn more.
Heritability is the fraction of phenotype variation that can be attributed to genetic differences, or genetic variance, among individuals in a population. The greater the hereditability of a population’s phenotypic variation, the more susceptible it is to the evolutionary forces that act on heritable variation.
The diversity of alleles and genotypes within a population is called genetic variance . When scientists are involved in the breeding of a species, such as with animals in zoos and nature preserves, they try to increase a population’s genetic variance to preserve as much of the phenotypic diversity as they can. This also helps reduce the risks associated with inbreeding , the mating of closely related individuals, which can have the undesirable effect of bringing together deleterious recessive mutations that can cause abnormalities and susceptibility to disease. For example, a disease that is caused by a rare, recessive allele might exist in a population, but it will only manifest itself when an individual carries two copies of the allele. Because the allele is rare in a normal, healthy population with unrestricted habitat, the chance that two carriers will mate is low, and even then, only 25 percent of their offspring will inherit the disease allele from both parents. While it is likely to happen at some point, it will not happen frequently enough for natural selection to be able to swiftly eliminate the allele from the population, and as a result, the allele will be maintained at low levels in the gene pool. However, if a family of carriers begins to interbreed with each other, this will dramatically increase the likelihood of two carriers mating and eventually producing diseased offspring, a phenomenon known as inbreeding depression .
Notification Switch
Would you like to follow the 'Biology' conversation and receive update notifications?

|
|

|
|

|
|

|
|

|
|
|
|
|

|
|

|
|

|
|

|
|

|