<< Chapter < Page Chapter >> Page >

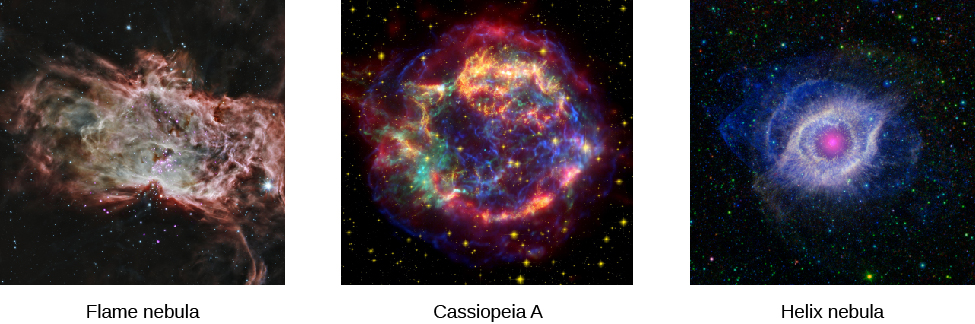
The first orbiting infrared observatory, launched in 1983, was the Infrared Astronomical Satellite (IRAS), built as a joint project by the United States, the Netherlands, and Britain. IRAS was equipped with a 0.6-meter telescope cooled to a temperature of less than 10 K. For the first time, the infrared sky could be seen as if it were night, rather than through a bright foreground of atmospheric and telescope emissions. IRAS carried out a rapid but comprehensive survey of the entire infrared sky over a 10-month period, cataloging about 350,000 sources of infrared radiation. Since then, several other infrared telescopes have operated in space with much better sensitivity and resolution due to improvements in infrared detectors. The most powerful of these infrared telescopes is the 0.85-meter Spitzer Space Telescope, which launched in 2003. A few of its observations are shown in [link] . With infrared observations, astronomers can detect cooler parts of cosmic objects, such as the dust clouds around star nurseries and the remnants of dying stars, that visible-light images don’t reveal.

Observations from the spitzer space telescope (sst).

Images returned from the Spitzer Space Telescope. These infrared images show from left (a) the Flame Nebula, a star forming region. Followed by (b) the supernova remnant Cassiopeia A, then, (c) the large planetary nebula known as the Helix Nebula.
These infrared images—a region of star formation, the remnant of an exploded star, and a region where an old star is losing its outer shell—show just a few of the observations made and transmitted back to Earth from the SST. Since our eyes are not sensitive to infrared rays, we don’t perceive colors from them. The colors in these images have been selected by astronomers to highlight details like the composition or temperature in these regions. (credit “Flame nebula”: modification of work by NASA (X-ray: NASA/CXC/PSU/K.Getman, E.Feigelson, M.Kuhn&the MYStIX team; Infrared:NASA/JPL-Caltech); credit “Cassiopeia A”: modification of work by NASA/JPL-Caltech; credit “Helix nebula”: modification of work by NASA/JPL-Caltech)

Hubble space telescope

In April 1990, a great leap forward in astronomy was made with the launch of the Hubble Space Telescope (HST). With an aperture of 2.4 meters, this is the largest telescope put into space so far. (Its aperture was limited by the size of the payload bay in the Space Shuttle that served as its launch vehicle.) It was named for Edwin Hubble, the astronomer who discovered the expansion of the universe in the 1920s (whose work we will discuss in the chapters on Galaxies ).

HST is operated jointly by NASA’s Goddard Space Flight Center and the Space Telescope Science Institute in Baltimore. It was the first orbiting observatory designed to be serviced by Shuttle astronauts and, over the years since it was launched, they made several visits to improve or replace its initial instruments and to repair some of the systems that operate the spacecraft ( [link] )—though this repair program has now been discontinued, and no more visits or improvements will be made.

With the Hubble, astronomers have obtained some of the most detailed images of astronomical objects from the solar system outward to the most distant galaxies. Among its many great achievements is the Hubble Ultra-Deep Field, an image of a small region of the sky observed for almost 100 hours. It contains views of about 10,000 galaxies, some of which formed when the universe was just a few percent of its current age ( [link] ).

Questions & Answers

differentiate between demand and supply giving examples
Lambiv Reply
differentiated between demand and supply using examples
Lambiv
what is labour ?
Lambiv
how will I do?
Venny Reply
how is the graph works?I don't fully understand
Rezat Reply
information
Eliyee
devaluation
Eliyee
t
WARKISA
hi guys good evening to all
Lambiv
multiple choice question
Aster Reply
appreciation
Eliyee
explain perfect market
Lindiwe Reply
In economics, a perfect market refers to a theoretical construct where all participants have perfect information, goods are homogenous, there are no barriers to entry or exit, and prices are determined solely by supply and demand. It's an idealized model used for analysis,
Ezea
What is ceteris paribus?
Shukri Reply
other things being equal
AI-Robot
When MP₁ becomes negative, TP start to decline. Extuples Suppose that the short-run production function of certain cut-flower firm is given by: Q=4KL-0.6K2 - 0.112 • Where is quantity of cut flower produced, I is labour input and K is fixed capital input (K-5). Determine the average product of lab
Kelo
Extuples Suppose that the short-run production function of certain cut-flower firm is given by: Q=4KL-0.6K2 - 0.112 • Where is quantity of cut flower produced, I is labour input and K is fixed capital input (K-5). Determine the average product of labour (APL) and marginal product of labour (MPL)
Kelo
yes,thank you
Shukri
Can I ask you other question?
Shukri
what is monopoly mean?
Habtamu Reply
What is different between quantity demand and demand?
Shukri Reply
Quantity demanded refers to the specific amount of a good or service that consumers are willing and able to purchase at a give price and within a specific time period. Demand, on the other hand, is a broader concept that encompasses the entire relationship between price and quantity demanded
Ezea
ok
Shukri
how do you save a country economic situation when it's falling apart
Lilia Reply
what is the difference between economic growth and development
Fiker Reply
Economic growth as an increase in the production and consumption of goods and services within an economy.but Economic development as a broader concept that encompasses not only economic growth but also social & human well being.
Shukri
production function means
Jabir
What do you think is more important to focus on when considering inequality ?
Abdisa Reply
any question about economics?
Awais Reply
sir...I just want to ask one question... Define the term contract curve? if you are free please help me to find this answer 🙏
Asui
it is a curve that we get after connecting the pareto optimal combinations of two consumers after their mutually beneficial trade offs
Awais
thank you so much 👍 sir
Asui
In economics, the contract curve refers to the set of points in an Edgeworth box diagram where both parties involved in a trade cannot be made better off without making one of them worse off. It represents the Pareto efficient allocations of goods between two individuals or entities, where neither p
Cornelius
In economics, the contract curve refers to the set of points in an Edgeworth box diagram where both parties involved in a trade cannot be made better off without making one of them worse off. It represents the Pareto efficient allocations of goods between two individuals or entities,
Cornelius
Suppose a consumer consuming two commodities X and Y has The following utility function u=X0.4 Y0.6. If the price of the X and Y are 2 and 3 respectively and income Constraint is birr 50. A,Calculate quantities of x and y which maximize utility. B,Calculate value of Lagrange multiplier. C,Calculate quantities of X and Y consumed with a given price. D,alculate optimum level of output .
Feyisa Reply
Answer
Feyisa
c
Jabir
the market for lemon has 10 potential consumers, each having an individual demand curve p=101-10Qi, where p is price in dollar's per cup and Qi is the number of cups demanded per week by the i th consumer.Find the market demand curve using algebra. Draw an individual demand curve and the market dema
Gsbwnw Reply
suppose the production function is given by ( L, K)=L¼K¾.assuming capital is fixed find APL and MPL. consider the following short run production function:Q=6L²-0.4L³ a) find the value of L that maximizes output b)find the value of L that maximizes marginal product
Abdureman
types of unemployment
Yomi Reply
What is the difference between perfect competition and monopolistic competition?
Mohammed
Got questions? Join the online conversation and get instant answers!
Jobilize.com Reply

Get Jobilize Job Search Mobile App in your pocket Now!

Get it on Google Play Download on the App Store Now


Source:  OpenStax, Astronomy. OpenStax CNX. Apr 12, 2017 Download for free at http://cnx.org/content/col11992/1.13
Google Play and the Google Play logo are trademarks of Google Inc.

Notification Switch

Would you like to follow the 'Astronomy' conversation and receive update notifications?

Ask