<< Chapter < Page Chapter >> Page >

Some key stages of evolution of the star that became SN 1987A, including the ones following helium exhaustion, are listed in [link] . While we don’t expect you to remember these numbers, note the patterns in the table: each stage of evolution happens more quickly than the preceding one, the temperature and pressure in the core increase, and progressively heavier elements are the source of fusion energy. Once iron was created, the collapse began. It was a catastrophic collapse, lasting only a few tenths of a second; the speed of infall in the outer portion of the iron core reached 70,000 kilometers per second, about one-fourth the speed of light.

Evolution of the Star That Exploded as SN 1987A
Phase Central Temperature (K) Central Density (g/cm 3 ) Time Spent in This Phase
Hydrogen fusion 40 × 10 6 5 8 × 10 6 years
Helium fusion 190 × 10 6 970 10 6 years
Carbon fusion 870 × 10 6 170,000 2000 years
Neon fusion 1.6 × 10 9 3.0 × 10 6 6 months
Oxygen fusion 2.0 × 10 9 5.6 × 10 6 1 year
Silicon fusion 3.3 × 10 9 4.3 × 10 7 Days
Core collapse 200 × 10 9 2 × 10 14 Tenths of a second

In the meantime, as the core was experiencing its last catastrophe, the outer shells of neon, oxygen, carbon, helium, and hydrogen in the star did not yet know about the collapse. Information about the physical movement of different layers travels through a star at the speed of sound and cannot reach the surface in the few tenths of a second required for the core collapse to occur. Thus, the surface layers of our star hung briefly suspended, much like a cartoon character who dashes off the edge of a cliff and hangs momentarily in space before realizing that he is no longer held up by anything.

The collapse of the core continued until the densities rose to several times that of an atomic nucleus. The resistance to further collapse then became so great that the core rebounded. Infalling material ran into the “brick wall” of the rebounding core and was thrown outward with a great shock wave. Neutrinos poured out of the core, helping the shock wave blow the star apart. The shock reached the surface of the star a few hours later, and the star began to brighten into the supernova Ian Shelton observed in 1987.

The synthesis of heavy elements

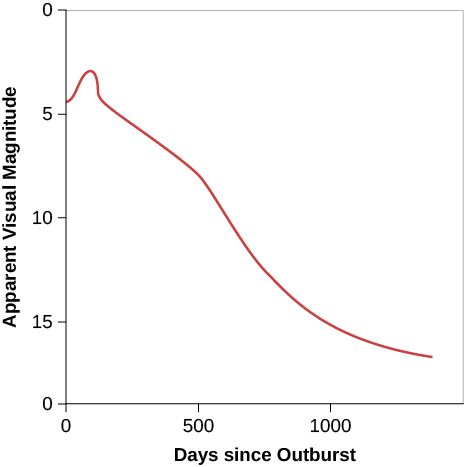
The variations in the brightness of SN 1987A in the days and months after its discovery, which are shown in [link] , helped confirm our ideas about heavy element production. In a single day, the star soared in brightness by a factor of about 1000 and became just visible without a telescope. The star then continued to increase slowly in brightness until it was about the same apparent magnitude as the stars in the Little Dipper. Up until about day 40 after the outburst, the energy being radiated away was produced by the explosion itself. But then SN 1987A did not continue to fade away, as we might have expected the light from the explosion to do. Instead, SN 1987A remained bright as energy from newly created radioactive elements came into play.

Change in the brightness of sn 1987a over time.

In this plot the vertical axis is labeled “Apparent visual magnitude”, and ranges from 19 at bottom to zero at top, in increments of one. The horizontal axis is labeled “Days since outburst”, and goes from zero at left to 1500 at right, in increments of 100 days. The data is plotted as a red curve beginning at zero days and magnitude 4.5, rises slightly to mag. 3 at 500 days, and steadily falls to mag. 17 at 1400 days.
Note how the rate of decline of the supernova’s light slowed between days 40 and 500. During this time, the brightness was mainly due to the energy emitted by newly formed (and quickly decaying) radioactive elements. Remember that magnitudes are a backward measure of brightness: the larger the magnitude, the dimmer the object looks.

Questions & Answers

it is the relatively stable flow of income
Chidubem Reply
what is circular flow of income
Divine Reply
branches of macroeconomics
SHEDRACK Reply
what is Flexible exchang rate?
poudel Reply
is gdp a reliable measurement of wealth
Atega Reply
introduction to econometrics
Husseini Reply
Hi
mostafa
hi
LEMLEM
hello
Sammol
hi
Mahesh
bi
Ruqayat
hi
Ruqayat
Hi fellas
Nyawa
hey
Sammol
hi
God
hello
Jahara
Good morning
Jorge
hi
abubakar
hi
Nmesoma
hi
Mahesh
Hi
Tom
Why is unemployment rate never zero at full employment?
Priyanka Reply
bcoz of existence of frictional unemployment in our economy.
Umashankar
what is flexible exchang rate?
poudel
due to existence of the pple with disabilities
Abdulraufu
the demand of a good rises, causing the demand for another good to fall
Rushawn Reply
is it possible to leave every good at the same level
Joseph
I don't think so. because check it, if the demand for chicken increases, people will no longer consume fish like they used to causing a fall in the demand for fish
Anuolu
is not really possible to let the value of a goods to be same at the same time.....
Salome
Suppose the inflation rate is 6%, does it mean that all the goods you purchase will cost 6% more than previous year? Provide with reasoning.
Geetha Reply
Not necessarily. To measure the inflation rate economists normally use an averaged price index of a basket of certain goods. So if you purchase goods included in the basket, you will notice that you pay 6% more, otherwise not necessarily.
Waeth
discus major problems of macroeconomics
Alii Reply
what is the problem of macroeconomics
Yoal
Economic growth Stable prices and low unemployment
Ephraim
explain inflationcause and itis degre
Miresa Reply
what is inflation
Getu
increase in general price levels
WEETO
Good day How do I calculate this question: C= 100+5yd G= 2000 T= 2000 I(planned)=200. Suppose the actual output is 3000. What is the level of planned expenditures at this level of output?
Chisomo Reply
how to calculate actual output?
Chisomo
how to calculate the equilibrium income
Beshir
Criteria for determining money supply
Thapase Reply
who we can define macroeconomics in one line
Muhammad
Aggregate demand
Mohammed
C=k100 +9y and i=k50.calculate the equilibrium level of output
Mercy Reply
Hi
Isiaka
Hi
Geli
hy
Man
👋
Bahunda
hy how are you?
Man
ys
Amisha
how are you guys
Sekou
f9 guys
Amisha
how are you guys
Sekou
ys am also fine
Amisha
fine and you guys
Geli
from Nepal
Amisha
nawalparasi district from belatari
Amisha
nd u
Amisha
I am Camara from Guinea west Africa... happy to meet you guys here
Sekou
ma management ho
Amisha
ahile becheclor ho
Amisha
hjr ktm bta ho ani k kaam grnu hunxa tw
Amisha
belatari
Amisha
1st year ho
Amisha
nd u
Amisha
ahh
Amisha
kaha biratnagar
Amisha
ys
Amisha
kina k vo
Amisha
money as unit of account means what?
Kalombe
A unit of account is something that can be used to value goods and services and make calculations
Jim
all of you please speak in English I can't understand you're language
Muhammad
I want to know how can we define macroeconomics in one line
Muhammad
it must be .9 or 0.9 no Mpc is greater than 1 Y=100+.9Y+50 Y-.9Y=150 0.1Y/0.1=150/0.1 Y=1500
Kalombe
Mercy is it clear?😋
Kalombe
hi can someone help me on this question If a negative shocks shifts the IS curve to the left, what type of policy do you suggest so as to stabilize the level of output? discuss your answer using appropriate graph.
Galge Reply
if interest rate is increased this will will reduce the level of income shifting the curve to the left ◀️
Kalombe
Got questions? Join the online conversation and get instant answers!
Jobilize.com Reply

Get Jobilize Job Search Mobile App in your pocket Now!

Get it on Google Play Download on the App Store Now


Source:  OpenStax, Astronomy. OpenStax CNX. Apr 12, 2017 Download for free at http://cnx.org/content/col11992/1.13
Google Play and the Google Play logo are trademarks of Google Inc.

Notification Switch

Would you like to follow the 'Astronomy' conversation and receive update notifications?

Ask