<< Chapter < Page Chapter >> Page >

Learning objectives

By the end of this section, you will be able to:

  • Define the main features of the celestial sphere
  • Explain the system astronomers use to describe the sky
  • Describe how motions of the stars appear to us on Earth
  • Describe how motions of the Sun, Moon, and planets appear to us on Earth
  • Understand the modern meaning of the term constellation

Our senses suggest to us that Earth is the center of the universe—the hub around which the heavens turn. This geocentric    (Earth-centered) view was what almost everyone believed until the European Renaissance. After all, it is simple, logical, and seemingly self-evident. Furthermore, the geocentric perspective reinforced those philosophical and religious systems that taught the unique role of human beings as the central focus of the cosmos. However, the geocentric view happens to be wrong. One of the great themes of our intellectual history is the overthrow of the geocentric perspective. Let us, therefore, take a look at the steps by which we reevaluated the place of our world in the cosmic order.

The celestial sphere

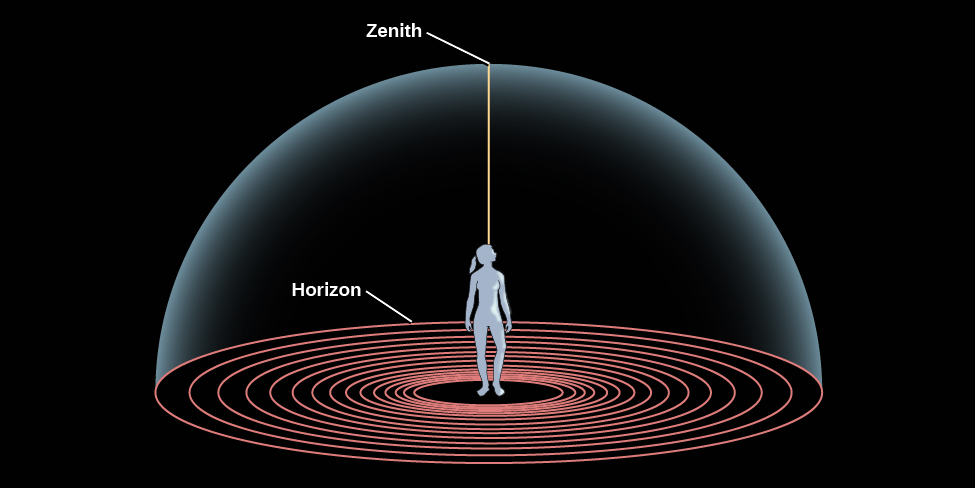
If you go on a camping trip or live far from city lights, your view of the sky on a clear night is pretty much identical to that seen by people all over the world before the invention of the telescope. Gazing up, you get the impression that the sky is a great hollow dome with you at the center ( [link] ), and all the stars are an equal distance from you on the surface of the dome. The top of that dome, the point directly above your head, is called the zenith    , and where the dome meets Earth is called the horizon . From the sea or a flat prairie, it is easy to see the horizon as a circle around you, but from most places where people live today, the horizon is at least partially hidden by mountains, trees, buildings, or smog.

The sky around us.

Diagram of the Horizon and the Zenith. In the center of this illustration a human figure stands looking upward. She is standing at the center of a series of concentric circles representing the ground, the outermost circle is labeled the “Horizon”. The sky is represented as a dome enclosing the figure and the ground the figure stands on. Thus, the dome meets the ground at the horizon. A line is drawn vertically upward from the figure to the top of the dome directly over the figure’s head, and is labeled the “Zenith”.
The horizon is where the sky meets the ground; an observer’s zenith is the point directly overhead.

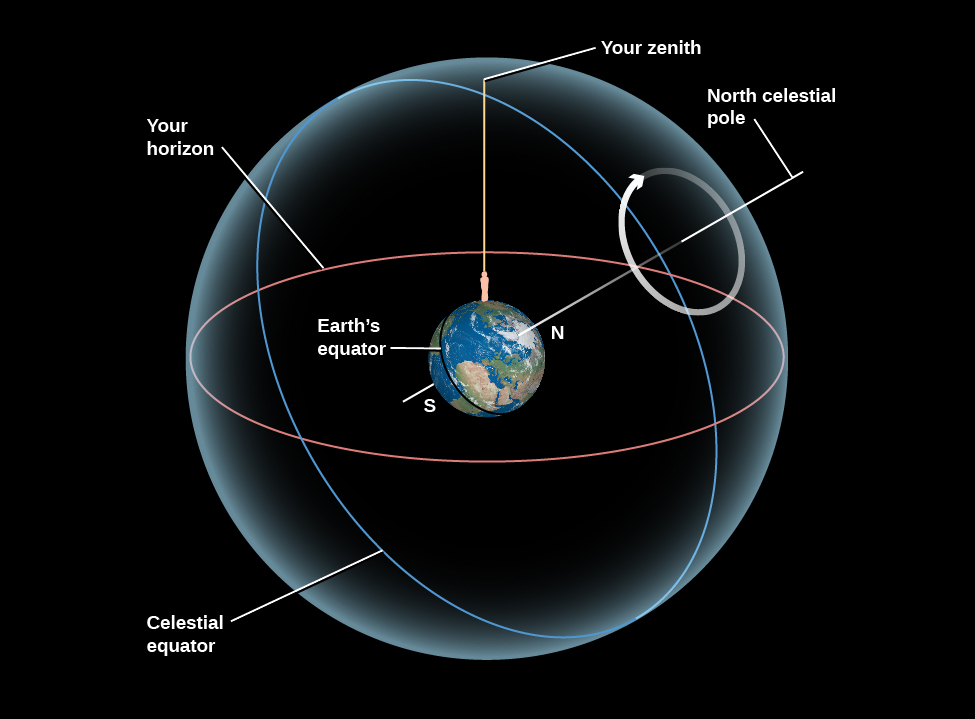
If you lie back in an open field and observe the night sky for hours, as ancient shepherds and travelers regularly did, you will see stars rising on the eastern horizon (just as the Sun and Moon do), moving across the dome of the sky in the course of the night, and setting on the western horizon. Watching the sky turn like this night after night, you might eventually get the idea that the dome of the sky is really part of a great sphere that is turning around you, bringing different stars into view as it turns. The early Greeks regarded the sky as just such a celestial sphere    ( [link] ). Some thought of it as an actual sphere of transparent crystalline material, with the stars embedded in it like tiny jewels.

Circles on the celestial sphere.

Circles on the Celestial Sphere. At the center of this figure the Earth is shown with the Equator, North, and South poles labeled. The Earth is tilted so that the North Pole is pointing toward the upper right. The Earth is embedded within a sphere representing the sky. A white line is drawn projecting from the North Pole onto the sky, at which point it is labeled the “North celestial pole”. A white circular arrow is drawn counter-clockwise around the North celestial pole indicating the apparent motion of the stars. The equator is projected onto the sky, drawn in white and is labeled the “Celestial equator”. An oversized human figure stands in North America, with a vertical line drawn upward and intersects the sky sphere at a point labeled “Your zenith”, and is drawn in yellow. The horizon as seen from the vantage point of the figure is projected onto the sky, labeled “Your horizon”, and is drawn in red. This horizon line splits the sky roughly in half from the observer’s point of view.
Here we show the (imaginary) celestial sphere around Earth, on which objects are fixed, and which rotates around Earth on an axis. In reality, it is Earth that turns around this axis, creating the illusion that the sky revolves around us. Note that Earth in this picture has been tilted so that your location is at the top and the North Pole is where the N is. The apparent motion of celestial objects in the sky around the pole is shown by the circular arrow.

Questions & Answers

What are the factors that affect demand for a commodity
Florence Reply
differentiate between demand and supply giving examples
Lambiv Reply
differentiated between demand and supply using examples
Lambiv
what is labour ?
Lambiv
how will I do?
Venny Reply
how is the graph works?I don't fully understand
Rezat Reply
information
Eliyee
devaluation
Eliyee
t
WARKISA
hi guys good evening to all
Lambiv
multiple choice question
Aster Reply
appreciation
Eliyee
explain perfect market
Lindiwe Reply
In economics, a perfect market refers to a theoretical construct where all participants have perfect information, goods are homogenous, there are no barriers to entry or exit, and prices are determined solely by supply and demand. It's an idealized model used for analysis,
Ezea
What is ceteris paribus?
Shukri Reply
other things being equal
AI-Robot
When MP₁ becomes negative, TP start to decline. Extuples Suppose that the short-run production function of certain cut-flower firm is given by: Q=4KL-0.6K2 - 0.112 • Where is quantity of cut flower produced, I is labour input and K is fixed capital input (K-5). Determine the average product of lab
Kelo
Extuples Suppose that the short-run production function of certain cut-flower firm is given by: Q=4KL-0.6K2 - 0.112 • Where is quantity of cut flower produced, I is labour input and K is fixed capital input (K-5). Determine the average product of labour (APL) and marginal product of labour (MPL)
Kelo
yes,thank you
Shukri
Can I ask you other question?
Shukri
what is monopoly mean?
Habtamu Reply
What is different between quantity demand and demand?
Shukri Reply
Quantity demanded refers to the specific amount of a good or service that consumers are willing and able to purchase at a give price and within a specific time period. Demand, on the other hand, is a broader concept that encompasses the entire relationship between price and quantity demanded
Ezea
ok
Shukri
how do you save a country economic situation when it's falling apart
Lilia Reply
what is the difference between economic growth and development
Fiker Reply
Economic growth as an increase in the production and consumption of goods and services within an economy.but Economic development as a broader concept that encompasses not only economic growth but also social & human well being.
Shukri
production function means
Jabir
What do you think is more important to focus on when considering inequality ?
Abdisa Reply
any question about economics?
Awais Reply
sir...I just want to ask one question... Define the term contract curve? if you are free please help me to find this answer 🙏
Asui
it is a curve that we get after connecting the pareto optimal combinations of two consumers after their mutually beneficial trade offs
Awais
thank you so much 👍 sir
Asui
In economics, the contract curve refers to the set of points in an Edgeworth box diagram where both parties involved in a trade cannot be made better off without making one of them worse off. It represents the Pareto efficient allocations of goods between two individuals or entities, where neither p
Cornelius
In economics, the contract curve refers to the set of points in an Edgeworth box diagram where both parties involved in a trade cannot be made better off without making one of them worse off. It represents the Pareto efficient allocations of goods between two individuals or entities,
Cornelius
Suppose a consumer consuming two commodities X and Y has The following utility function u=X0.4 Y0.6. If the price of the X and Y are 2 and 3 respectively and income Constraint is birr 50. A,Calculate quantities of x and y which maximize utility. B,Calculate value of Lagrange multiplier. C,Calculate quantities of X and Y consumed with a given price. D,alculate optimum level of output .
Feyisa Reply
Answer
Feyisa
c
Jabir
the market for lemon has 10 potential consumers, each having an individual demand curve p=101-10Qi, where p is price in dollar's per cup and Qi is the number of cups demanded per week by the i th consumer.Find the market demand curve using algebra. Draw an individual demand curve and the market dema
Gsbwnw Reply
suppose the production function is given by ( L, K)=L¼K¾.assuming capital is fixed find APL and MPL. consider the following short run production function:Q=6L²-0.4L³ a) find the value of L that maximizes output b)find the value of L that maximizes marginal product
Abdureman
Got questions? Join the online conversation and get instant answers!
Jobilize.com Reply

Get Jobilize Job Search Mobile App in your pocket Now!

Get it on Google Play Download on the App Store Now


Source:  OpenStax, Astronomy. OpenStax CNX. Apr 12, 2017 Download for free at http://cnx.org/content/col11992/1.13
Google Play and the Google Play logo are trademarks of Google Inc.

Notification Switch

Would you like to follow the 'Astronomy' conversation and receive update notifications?

Ask