

| << Chapter < Page | Chapter >> Page > |
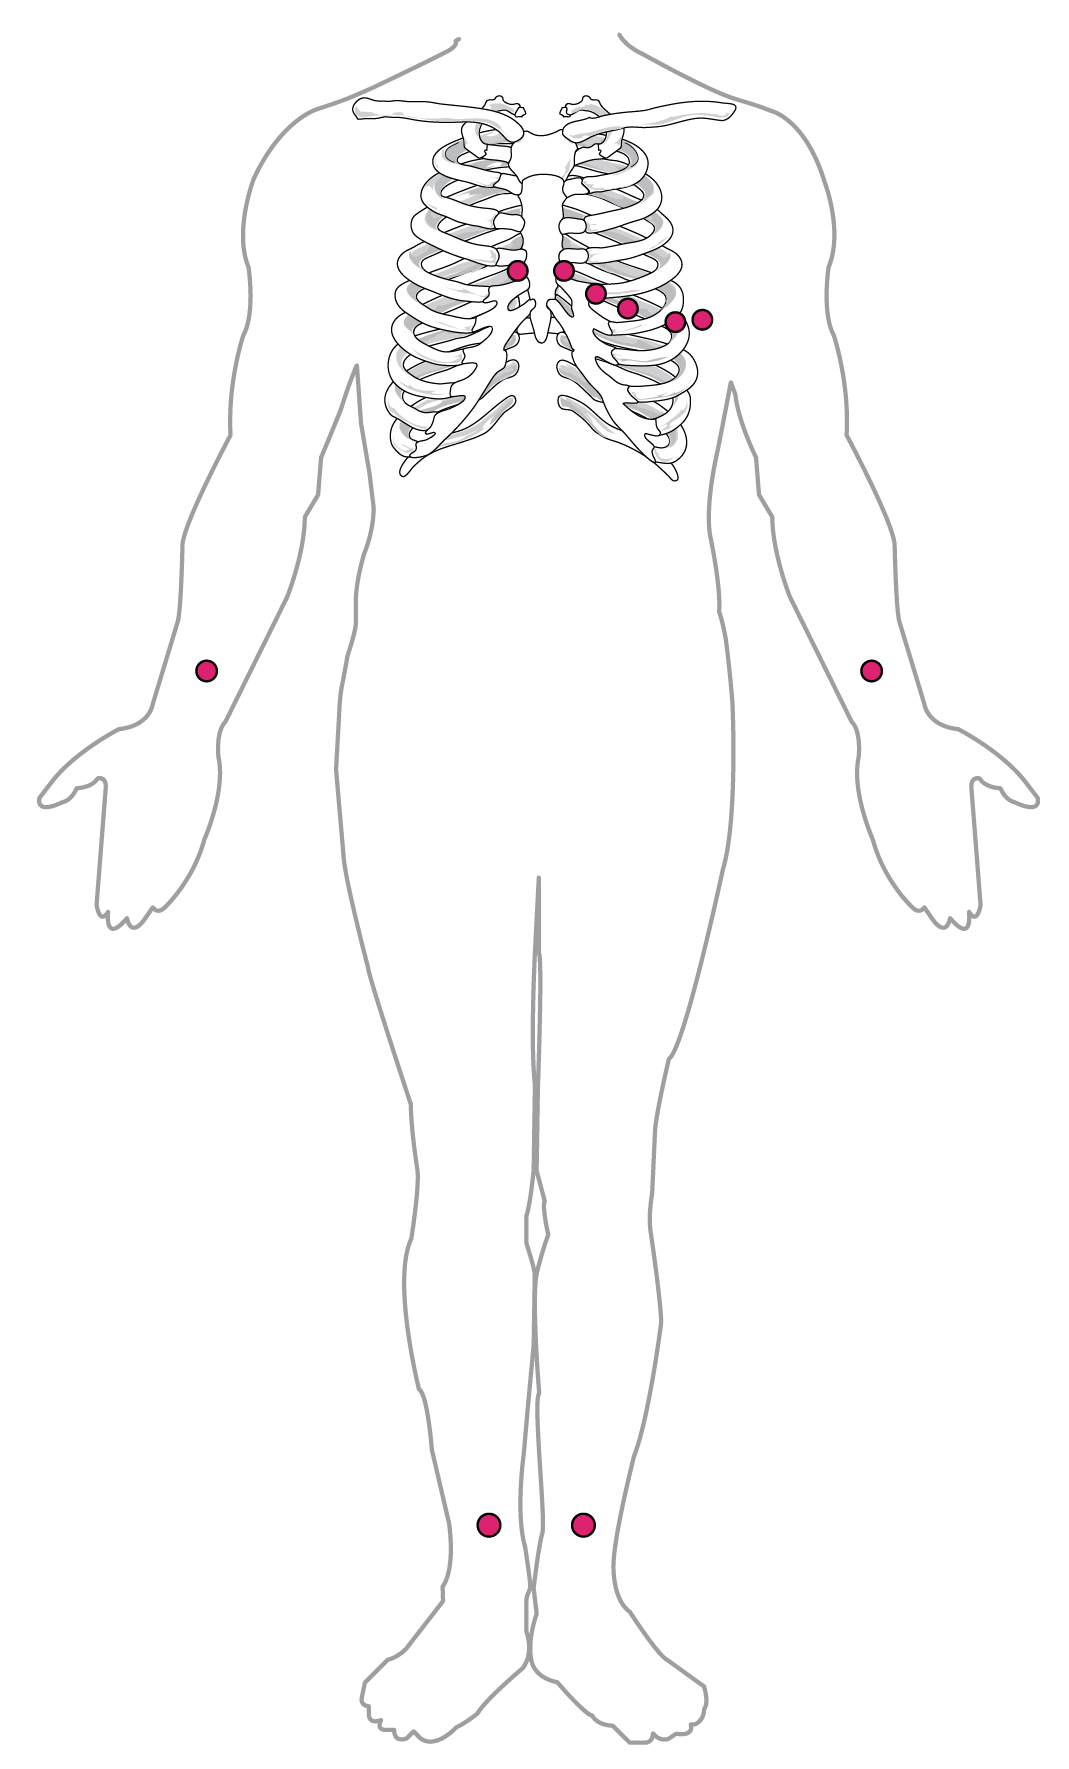
By careful placement of surface electrodes on the body, it is possible to record the complex, compound electrical signal of the heart. This tracing of the electrical signal is the electrocardiogram (ECG) , also commonly abbreviated EKG (K coming kardiology, from the German term for cardiology). Careful analysis of the ECG reveals a detailed picture of both normal and abnormal heart function, and is an indispensable clinical diagnostic tool. The standard electrocardiograph (the instrument that generates an ECG) uses 3, 5, or 12 leads. The greater the number of leads an electrocardiograph uses, the more information the ECG provides. The term “lead” may be used to refer to the cable from the electrode to the electrical recorder, but it typically describes the voltage difference between two of the electrodes. The 12-lead electrocardiograph uses 10 electrodes placed in standard locations on the patient’s skin ( [link] ). In continuous ambulatory electrocardiographs, the patient wears a small, portable, battery-operated device known as a Holter monitor, or simply a Holter, that continuously monitors heart electrical activity, typically for a period of 24 hours during the patient’s normal routine.
A normal ECG tracing is presented in [link] . Each component, segment, and interval is labeled and corresponds to important electrical events, demonstrating the relationship between these events and contraction in the heart.
There are five prominent points on the ECG: the P wave, the QRS complex, and the T wave. The small P wave represents the depolarization of the atria. The atria begin contracting approximately 25 ms after the start of the P wave. The large QRS complex represents the depolarization of the ventricles, which requires a much stronger electrical signal because of the larger size of the ventricular cardiac muscle. The ventricles begin to contract as the QRS reaches the peak of the R wave. Lastly, the T wave represents the repolarization of the ventricles. The repolarization of the atria occurs during the QRS complex, which masks it on an ECG.
The major segments and intervals of an ECG tracing are indicated in [link] . Segments are defined as the regions between two waves. Intervals include one segment plus one or more waves. For example, the PR segment begins at the end of the P wave and ends at the beginning of the QRS complex. The PR interval starts at the beginning of the P wave and ends with the beginning of the QRS complex. The PR interval is more clinically relevant, as it measures the duration from the beginning of atrial depolarization (the P wave) to the initiation of the QRS complex. Since the Q wave may be difficult to view in some tracings, the measurement is often extended to the R that is more easily visible. Should there be a delay in passage of the impulse from the SA node to the AV node, it would be visible in the PR interval. [link] correlates events of heart contraction to the corresponding segments and intervals of an ECG.
Notification Switch
Would you like to follow the 'Anatomy & Physiology' conversation and receive update notifications?

|
|
|
|
|

|
|

|
|

|
|

|
|

|
|

|
|

|
|

|
|

|
|

|