<< Chapter < Page Chapter >> Page >

Solve the system by graphing. { y 3 x + 1 −3 x + y −4

y 3 x + 1
This figure shows a graph on an x y-coordinate plane of y is greater than or equal to 3x + 1 and -3x + y is greater than or equal to -4. The area to the left of each line is shaded with the overlapping area shaded a slightly different color.

Got questions? Get instant answers now!

Solve the system by graphing. { y 1 4 x + 2 x + 4 y 4

x + 4 y 4
This figure shows a graph on an x y-coordinate plane of y is less than or equal to –(1/4)x + 2 and x + 4y is less than or equal to 4. The area to the below each line is shaded with the overlapping area shaded a slightly different color.

Got questions? Get instant answers now!

Solve applications of systems of inequalities

The first thing we’ll need to do to solve applications of systems of inequalities is to translate each condition into an inequality. Then we graph the system as we did above to see the region that contains the solutions. Many situations will be realistic only if both variables are positive, so their graphs will only show Quadrant I.

Christy sells her photographs at a booth at a street fair. At the start of the day, she wants to have at least 20 photos to display at her booth. Each small photo she displays costs her $4 and each large photo costs her $10. She doesn’t want to spend more than $200 on photos to display.

Write a system of inequalities to model this situation.

Graph the system.

Could she display 15 small and 5 large photos?

Could she display 3 large and 22 small photos?
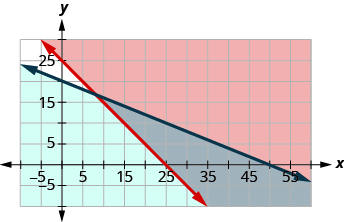
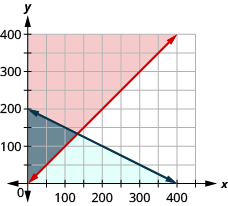
Solution

  1. Let x = the number of small photos.
    y = the number of large photos
    To find the system of inequalities, translate the information.
    She wants to have at least 25 photos. The number of small plus the number of large should be at least 25. x + y 25 $4 for each small and $10 for each large must be no more than $200 4 x + 10 y 200
    We have our system of inequalities. { x + y 25 4 x + 10 y 200

  2. To graph x + y 25 , graph x + y = 25 as a solid line.
    Choose (0, 0) as a test point. Since it does not make the inequality
    true, shade the side that does not include the point (0, 0) red.

    To graph 4 x + 10 y 200 , graph 4 x + 10 y = 200 as a solid line.
    Choose (0, 0) as a test point. Since it does not make the inequality
    true, shade the side that includes the point (0, 0) blue.
    .

    The solution of the system is the region of the graph that is double shaded and so is shaded darker.
  3. To determine if 10 small and 20 large photos would work, we see if the point (10, 20) is in the solution region. It is not. Christy would not display 10 small and 20 large photos.
  4. To determine if 20 small and 10 large photos would work, we see if the point (20, 10) is in the solution region. It is. Christy could choose to display 20 small and 10 large photos.

Notice that we could also test the possible solutions by substituting the values into each inequality.

Got questions? Get instant answers now!

A trailer can carry a maximum weight of 160 pounds and a maximum volume of 15 cubic feet. A microwave oven weighs 30 pounds and has 2 cubic feet of volume, while a printer weighs 20 pounds and has 3 cubic feet of space.

Write a system of inequalities to model this situation.
Graph the system.
Could 4 microwaves and 2 printers be carried on this trailer?
Could 7 microwaves and 3 printers be carried on this trailer?

  1. { 30 m + 20 p 160 2 m + 3 p 15

  2. This figure shows a graph on an x y-coordinate plane of 30m + 20p is less than or equal 160 and 2m + 3p is less than or equal to 15. The area to the left of each line is shaded with the overlapping area shaded a slightly different color.
  3. yes
  4. no
Got questions? Get instant answers now!

Mary needs to purchase supplies of answer sheets and pencils for a standardized test to be given to the juniors at her high school. The number of the answer sheets needed is at least 5 more than twice the number of pencils. The pencils cost $2 and the answer sheets cost $1. Mary’s budget for these supplies allows for a maximum cost of $400.

Write a system of inequalities to model this situation.
Graph the system.
Could Mary purchase 100 pencils and 100 answer sheets?
Could Mary purchase 150 pencils and 150 answer sheets?

  1. { a p + 5 a + 2 p 400

  2. This figure shows a graph on an x y-coordinate plane of a is greater than or equal to p + 5 and a + 2p is less than or equal to 400. The area to the left of each line is shaded different colors with the overlapping area also shaded a different color.
  3. yes
  4. no
Got questions? Get instant answers now!
Practice Key Terms 1

Get Jobilize Job Search Mobile App in your pocket Now!

Get it on Google Play Download on the App Store Now


Source:  OpenStax, Elementary algebra. OpenStax CNX. Jan 18, 2017 Download for free at http://cnx.org/content/col12116/1.2
Google Play and the Google Play logo are trademarks of Google Inc.

Notification Switch

Would you like to follow the 'Elementary algebra' conversation and receive update notifications?

Ask