

| << Chapter < Page | Chapter >> Page > |
Before you get started, take this readiness quiz.
We have graphed linear equations by plotting points, using intercepts, recognizing horizontal and vertical lines, and using the point–slope method. Once we see how an equation in slope–intercept form and its graph are related, we’ll have one more method we can use to graph lines.
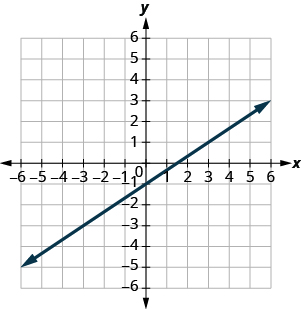
In Graph Linear Equations in Two Variables , we graphed the line of the equation by plotting points. See [link] . Let’s find the slope of this line.
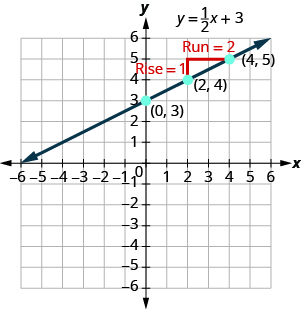
The red lines show us the rise is 1 and the run is 2. Substituting into the slope formula:
What is the y -intercept of the line? The y -intercept is where the line crosses the y -axis, so y -intercept is . The equation of this line is:

Notice, the line has:
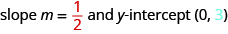
When a linear equation is solved for , the coefficient of the term is the slope and the constant term is the y -coordinate of the y -intercept. We say that the equation is in slope–intercept form.
The slope–intercept form of an equation of a line with slope and y -intercept, is,
Sometimes the slope–intercept form is called the “ y -form.”
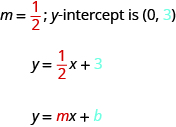
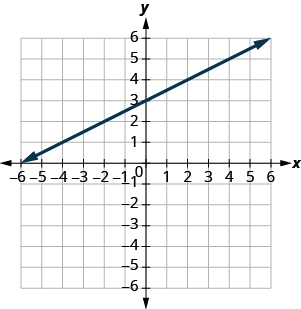
Use the graph to find the slope and y -intercept of the line, .
Compare these values to the equation .
To find the slope of the line, we need to choose two points on the line. We’ll use the points and .
 | |
| Find the rise and run. |
 |
 | |
 | |
| Find the y -intercept of the line. | The y -intercept is the point (0, 1). |
 |
 |
The slope is the same as the coefficient of and the y -coordinate of the y -intercept is the same as the constant term.
Use the graph to find the slope and y -intercept of the line . Compare these values to the equation .
slope and y -intercept
Use the graph to find the slope and y -intercept of the line . Compare these values to the equation .
slope and y -intercept
In Understand Slope of a Line , we graphed a line using the slope and a point. When we are given an equation in slope–intercept form, we can use the y -intercept as the point, and then count out the slope from there. Let’s practice finding the values of the slope and y -intercept from the equation of a line.
Identify the slope and y -intercept of the line with equation .
We compare our equation to the slope–intercept form of the equation.
 | |
| Write the equation of the line. |
 |
| Identify the slope. |
 |
| Identify the y -intercept. |
 |
Notification Switch
Would you like to follow the 'Elementary algebra' conversation and receive update notifications?

|
|

|
|

|
|

|
|
|
|
|

|
|

|
|

|
|

|
|

|