

| << Chapter < Page | Chapter >> Page > |
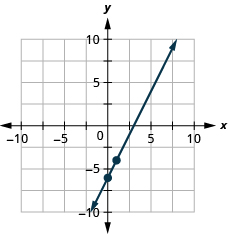
Graph the line of the equation using its slope and y -intercept.
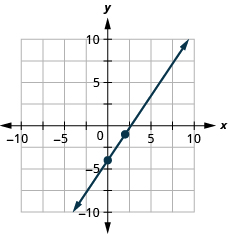
Graph the line of the equation using its slope and y -intercept.
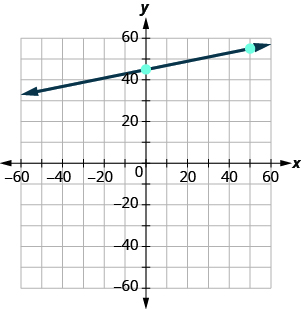
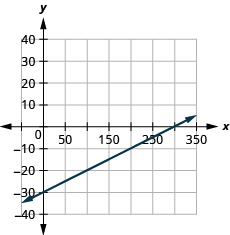
We have used a grid with and both going from about to 10 for all the equations we’ve graphed so far. Not all linear equations can be graphed on this small grid. Often, especially in applications with real-world data, we’ll need to extend the axes to bigger positive or smaller negative numbers.
Graph the line of the equation using its slope and y -intercept.
We’ll use a grid with the axes going from about to 80.
| The equation is in slope–intercept form. | |
| Identify the slope and y -intercept. | |
| The y -intercept is (0, 45) | |
| Plot the y -intercept. | See graph below. |
| Count out the rise and run to mark the second point. The slope is ; in fraction form this means . Given the scale of our graph, it would be easier to use the equivalent fraction . | |
| Draw the line. |
 |
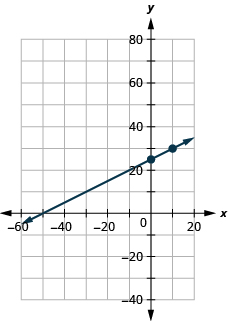
Graph the line of the equation using its slope and y -intercept.
Graph the line of the equation using its slope and y -intercept.
Now that we have graphed lines by using the slope and y -intercept, let’s summarize all the methods we have used to graph lines. See [link] .
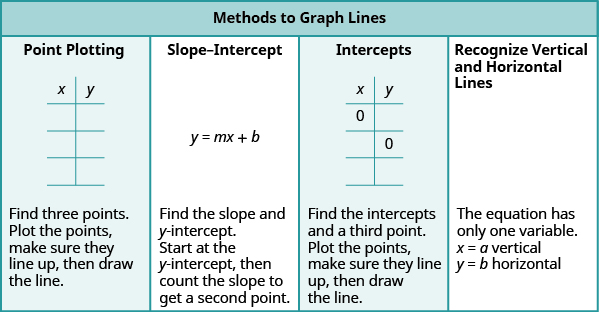
Now that we have seen several methods we can use to graph lines, how do we know which method to use for a given equation?
While we could plot points, use the slope–intercept form, or find the intercepts for any equation, if we recognize the most convenient way to graph a certain type of equation, our work will be easier. Generally, plotting points is not the most efficient way to graph a line. We saw better methods in sections 4.3, 4.4, and earlier in this section. Let’s look for some patterns to help determine the most convenient method to graph a line.
Here are six equations we graphed in this chapter, and the method we used to graph each of them.
Equations #1 and #2 each have just one variable. Remember, in equations of this form the value of that one variable is constant; it does not depend on the value of the other variable. Equations of this form have graphs that are vertical or horizontal lines.
In equations #3 and #4, both and are on the same side of the equation. These two equations are of the form . We substituted to find the x -intercept and to find the y -intercept, and then found a third point by choosing another value for or .
Equations #5 and #6 are written in slope–intercept form. After identifying the slope and y -intercept from the equation we used them to graph the line.
This leads to the following strategy.
Consider the form of the equation.
Notification Switch
Would you like to follow the 'Elementary algebra' conversation and receive update notifications?

|
|

|
|

|
|

|
|

|
|

|
|

|
|

|
|

|
|

|