| << Chapter < Page | Chapter >> Page > |
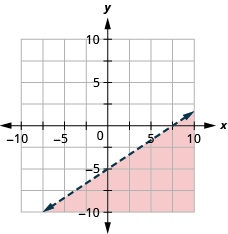
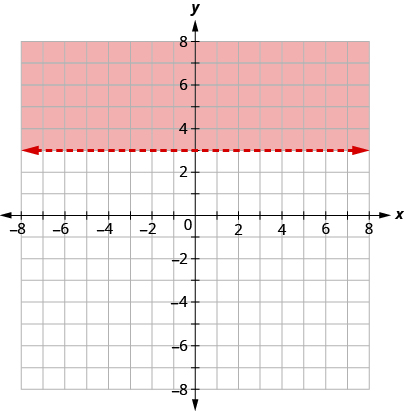
The boundary line shown is . Write the inequality shown by the graph.
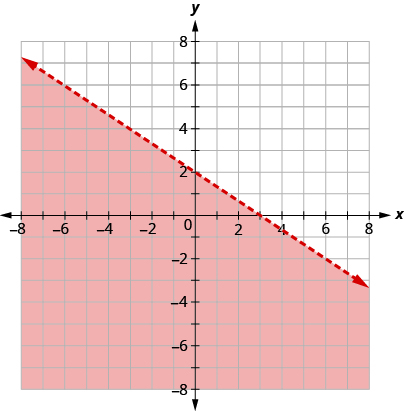
The line is the boundary line. On one side of the line are the points with and on the other side of the line are the points with .
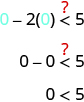
Let’s test the point and see which inequality describes its side of the boundary line.
At , which inequality is true:
So the side with is the side where .
(You may want to pick a point on the other side of the boundary line and check that .)
Since the boundary line is graphed as a dashed line, the inequality does not include an equal sign.
The graph shows the solution to the inequality .
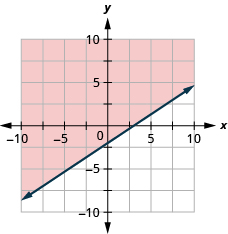
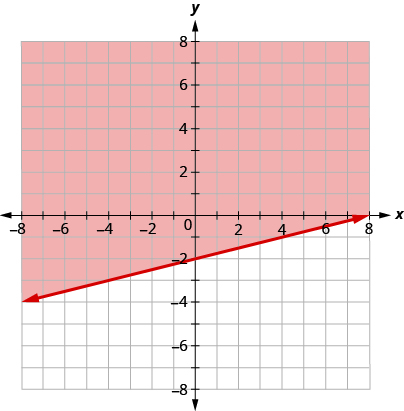
Write the inequality shown by the shaded region in the graph with the boundary line .
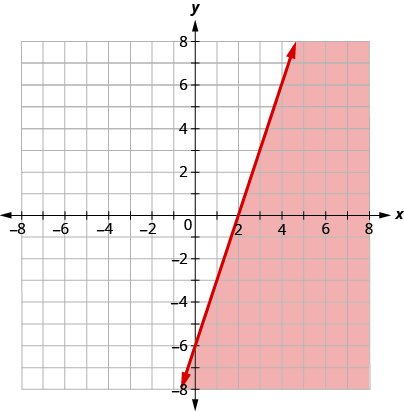
Write the inequality shown by the shaded region in the graph with the boundary line .
Now, we’re ready to put all this together to graph linear inequalities.
The steps we take to graph a linear inequality are summarized here.
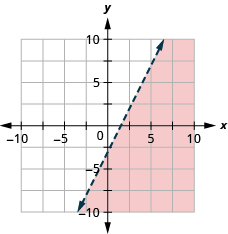
Graph the linear inequality .
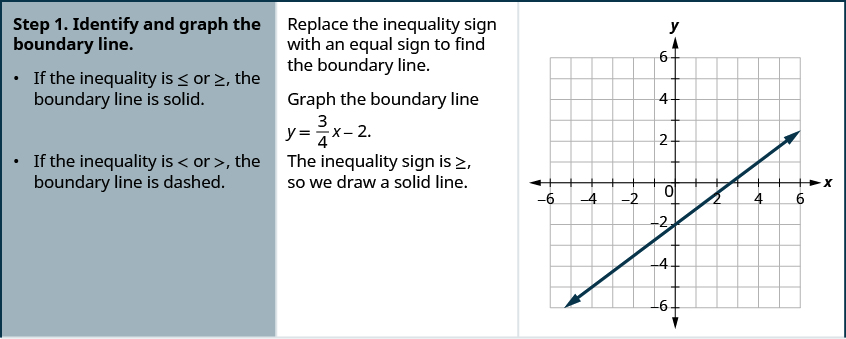
First we graph the boundary line . The inequality is so we draw a dashed line.
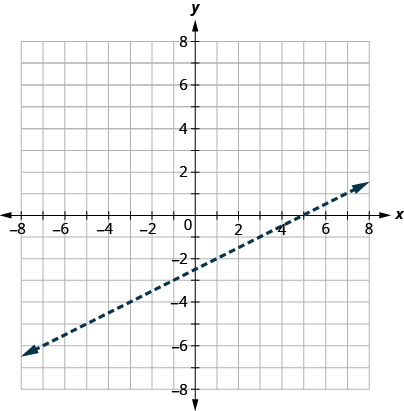
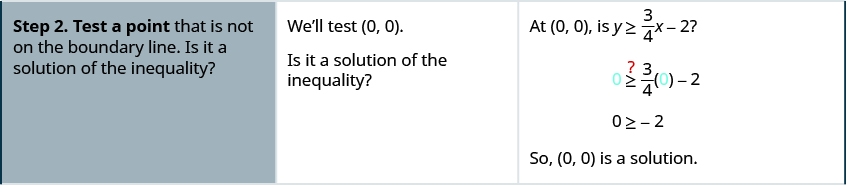
Then we test a point. We’ll use again because it is easy to evaluate and it is not on the boundary line.
Is
a solution of
?
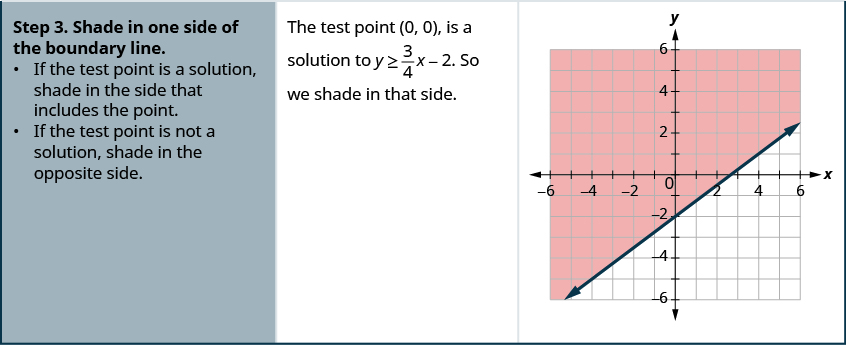
The point
is a solution of
, so we shade in that side of the boundary line.
What if the boundary line goes through the origin? Then we won’t be able to use as a test point. No problem—we’ll just choose some other point that is not on the boundary line.
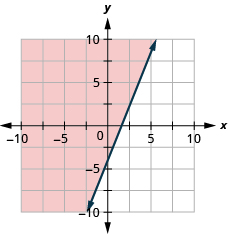
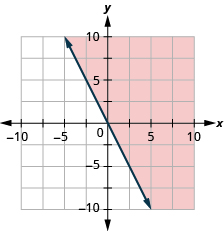
Graph the linear inequality .
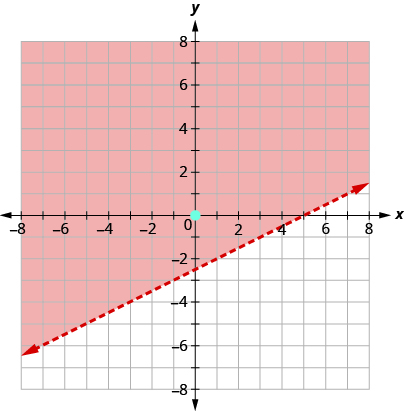
First we graph the boundary line
. It is in slope–intercept form, with
. The inequality is
so we draw a solid line.
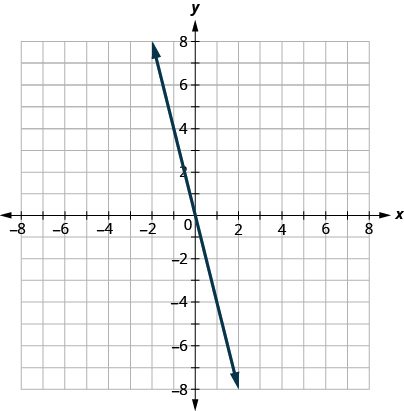
Now, we need a test point. We can see that the point is not on the boundary line.
Is
a solution of
?

The point is not a solution to , so we shade in the opposite side of the boundary line. See [link] .
Some linear inequalities have only one variable. They may have an x but no y , or a y but no x . In these cases, the boundary line will be either a vertical or a horizontal line. Do you remember?
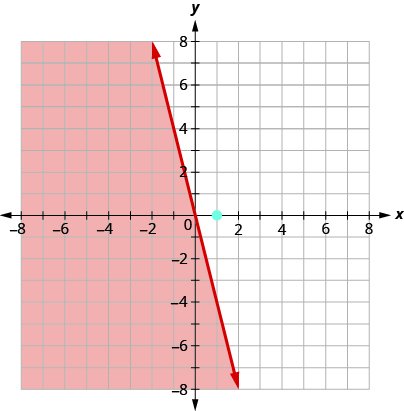
Graph the linear inequality .
First we graph the boundary line . It is a horizontal line. The inequality is>so we draw a dashed line.
We test the point .
is not a solution to .
So we shade the side that does not include (0, 0).
Notification Switch
Would you like to follow the 'Elementary algebra' conversation and receive update notifications?

|
|

|
|

|
|

|
|

|
|

|
|

|
|

|
|

|
|

|