| << Chapter < Page | Chapter >> Page > |
Verify Solutions to an Inequality in Two Variables
In the following exercises, determine whether each ordered pair is a solution to the given inequality.
Determine whether each ordered pair is a solution to the inequality :
ⓐ
ⓑ
ⓒ
ⓓ
ⓔ
Determine whether each ordered pair is a solution to the inequality :
ⓐ
ⓑ
ⓒ
ⓓ
ⓔ
ⓐ yes ⓑ no ⓒ no ⓓ yes ⓔ no
Determine whether each ordered pair is a solution to the inequality :
ⓐ
ⓑ
ⓒ
ⓓ
ⓔ
Determine whether each ordered pair is a solution to the inequality :
ⓐ
ⓑ
ⓒ
ⓓ
ⓔ
ⓐ yes ⓑ no ⓒ no ⓓ yes ⓔ yes
Determine whether each ordered pair is a solution to the inequality :
ⓐ
ⓑ
ⓒ
ⓓ
ⓔ
Determine whether each ordered pair is a solution to the inequality :
ⓐ
ⓑ
ⓒ
ⓓ
ⓔ
ⓐ no ⓑ no ⓒ no ⓓ yes ⓔ yes
Recognize the Relation Between the Solutions of an Inequality and its Graph
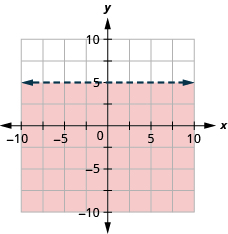
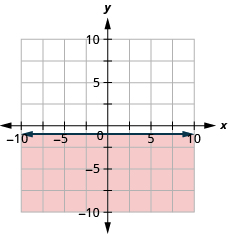
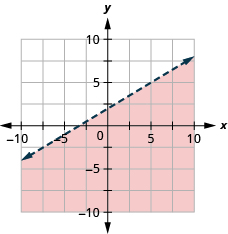
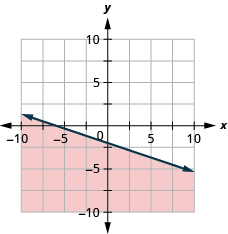
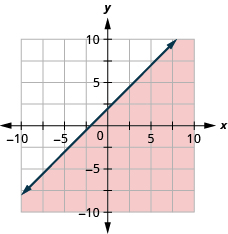
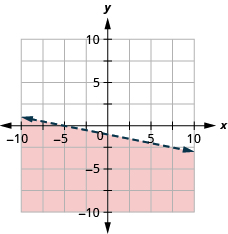
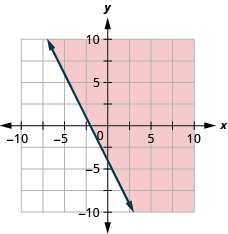
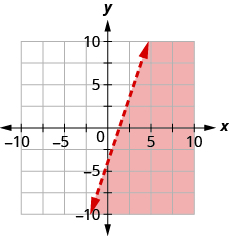
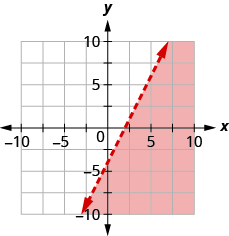
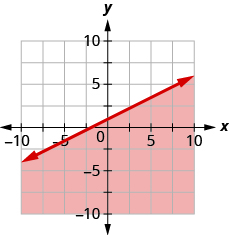
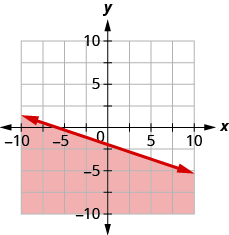
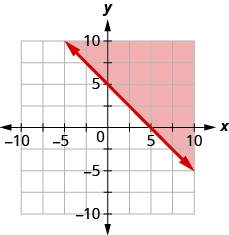
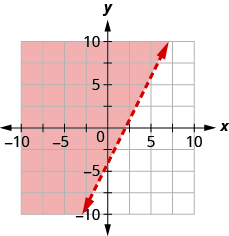
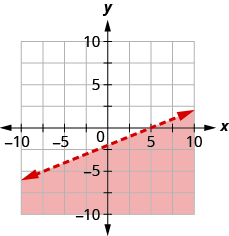
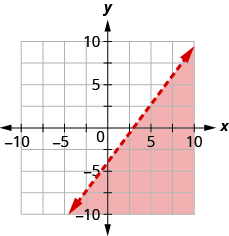
In the following exercises, write the inequality shown by the shaded region.
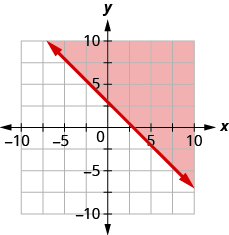
Write the inequality shown by the graph with the boundary line
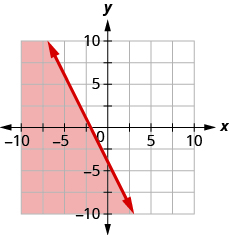
Write the inequality shown by the graph with the boundary line
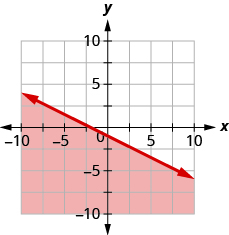
Write the inequality shown by the graph with the boundary line
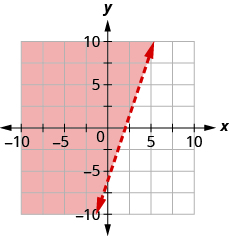
Write the inequality shown by the graph with the boundary line
Write the inequality shown by the shaded region in the graph with the boundary line
Write the inequality shown by the shaded region in the graph with the boundary line
Write the inequality shown by the shaded region in the graph with the boundary line
Write the inequality shown by the shaded region in the graph with the boundary line
Write the inequality shown by the shaded region in the graph with the boundary line
Write the inequality shown by the shaded region in the graph with the boundary line
Write the inequality shown by the shaded region in the graph with the boundary line
Write the inequality shown by the shaded region in the graph with the boundary line
Graph Linear Inequalities
In the following exercises, graph each linear inequality.
Graph the linear inequality .
Graph the linear inequality .
Graph the linear inequality .
Graph the linear inequality .
Graph the linear inequality .
Notification Switch
Would you like to follow the 'Elementary algebra' conversation and receive update notifications?

|
|

|
|

|
|

|
|

|
|

|
|

|
|

|
|

|
|

|