| << Chapter < Page | Chapter >> Page > |
Before you get started, take this readiness quiz.
How do online retailers know that ‘you may also like’ a particular item based on something you just ordered? How can economists know how a rise in the minimum wage will affect the unemployment rate? How do medical researchers create drugs to target cancer cells? How can traffic engineers predict the effect on your commuting time of an increase or decrease in gas prices? It’s all mathematics.
You are at an exciting point in your mathematical journey as the mathematics you are studying has interesting applications in the real world.
The physical sciences, social sciences, and the business world are full of situations that can be modeled with linear equations relating two variables. Data is collected and graphed. If the data points appear to form a straight line, an equation of that line can be used to predict the value of one variable based on the value of the other variable.
To create a mathematical model of a linear relation between two variables, we must be able to find the equation of the line. In this section we will look at several ways to write the equation of a line. The specific method we use will be determined by what information we are given.
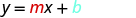
We can easily determine the slope and intercept of a line if the equation was written in slope–intercept form, Now, we will do the reverse—we will start with the slope and y -intercept and use them to find the equation of the line.
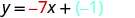
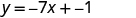
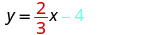
Find an equation of a line with slope and y -intercept .
Since we are given the slope and y -intercept of the line, we can substitute the needed values into the slope–intercept form, .
| Name the slope. |
 |
| Name the y -intercept. |
 |
| Substitute the values into |
 |
 | |
 |
Sometimes, the slope and intercept need to be determined from the graph.
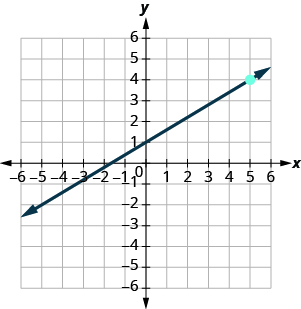
Find the equation of the line shown.
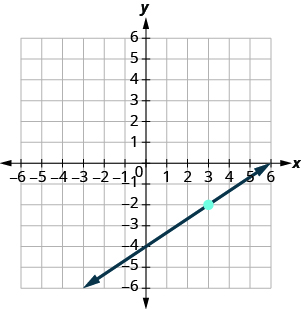
We need to find the slope and y -intercept of the line from the graph so we can substitute the needed values into the slope–intercept form, .
To find the slope, we choose two points on the graph.
The y -intercept is and the graph passes through .
| Find the slope by counting the rise and run. |
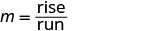 |
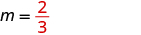 | |
| Find the y -intercept. |
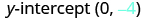 |
| Substitute the values into |
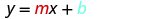 |
 |
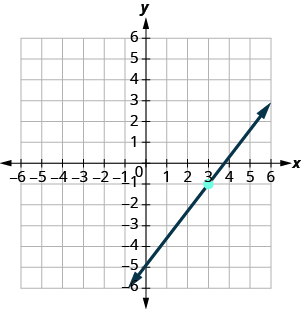
Finding an equation of a line using the slope–intercept form of the equation works well when you are given the slope and y -intercept or when you read them off a graph. But what happens when you have another point instead of the y -intercept?
Notification Switch
Would you like to follow the 'Elementary algebra' conversation and receive update notifications?

|
|

|
|

|
|
|
|
|

|
|

|
|

|
|

|
|

|
|

|