

| << Chapter < Page | Chapter >> Page > |
Before you get started, take this readiness quiz.
Just like maps use a grid system to identify locations, a grid system is used in algebra to show a relationship between two variables in a rectangular coordinate system . The rectangular coordinate system is also called the xy -plane or the ‘coordinate plane’.
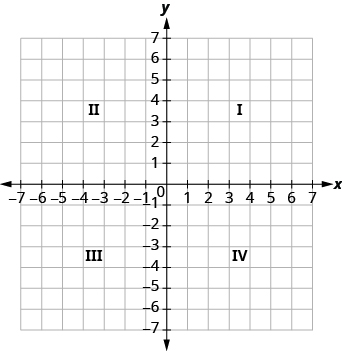
The horizontal number line is called the x-axis . The vertical number line is called the y-axis. The x -axis and the y -axis together form the rectangular coordinate system. These axes divide a plane into four regions, called quadrants . The quadrants are identified by Roman numerals, beginning on the upper right and proceeding counterclockwise. See [link] .
In the rectangular coordinate system , every point is represented by an ordered pair . The first number in the ordered pair is the x -coordinate of the point, and the second number is the y -coordinate of the point.
An ordered pair , , gives the coordinates of a point in a rectangular coordinate system.

The first number is the x -coordinate.
The second number is the y -coordinate.
The phrase ‘ordered pair’ means the order is important. What is the ordered pair of the point where the axes cross? At that point both coordinates are zero, so its ordered pair is . The point has a special name. It is called the origin .
The point is called the origin . It is the point where the x -axis and y -axis intersect.
We use the coordinates to locate a point on the xy -plane. Let’s plot the point as an example. First, locate 1 on the x -axis and lightly sketch a vertical line through . Then, locate 3 on the y -axis and sketch a horizontal line through . Now, find the point where these two lines meet—that is the point with coordinates .
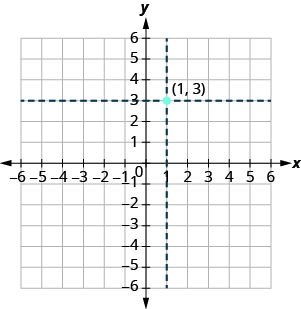
Notice that the vertical line through and the horizontal line through are not part of the graph. We just used them to help us locate the point .
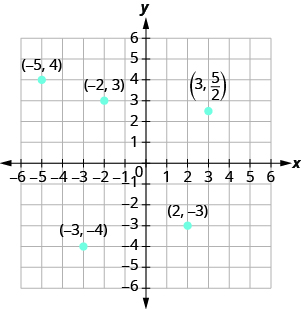
Plot each point in the rectangular coordinate system and identify the quadrant in which the point is located:
ⓐ ⓑ ⓒ ⓓ ⓔ .
The first number of the coordinate pair is the x -coordinate, and the second number is the y -coordinate.
Notification Switch
Would you like to follow the 'Elementary algebra' conversation and receive update notifications?

|
|

|
|

|
|
|
|
|

|
|

|
|

|
|

|
|

|
|

|