| << Chapter < Page | Chapter >> Page > |
Before you get started, take this readiness quiz.
Do you remember what it means for a number to be a solution to an equation? A solution of an equation is a value of a variable that makes a true statement when substituted into the equation.
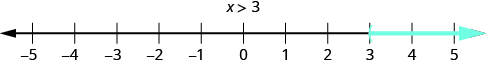
What about the solution of an inequality? What number would make the inequality true? Are you thinking, ‘ x could be 4’? That’s correct, but x could be 5 too, or 20, or even 3.001. Any number greater than 3 is a solution to the inequality .
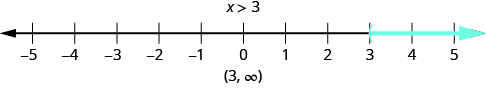
We show the solutions to the inequality on the number line by shading in all the numbers to the right of 3, to show that all numbers greater than 3 are solutions. Because the number 3 itself is not a solution, we put an open parenthesis at 3. The graph of is shown in [link] . Please note that the following convention is used: light blue arrows point in the positive direction and dark blue arrows point in the negative direction.
The graph of the inequality is very much like the graph of , but now we need to show that 3 is a solution, too. We do that by putting a bracket at , as shown in [link] .
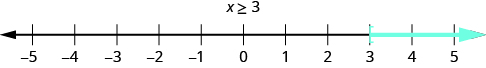
Notice that the open parentheses symbol, (, shows that the endpoint of the inequality is not included. The open bracket symbol, [, shows that the endpoint is included.
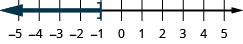
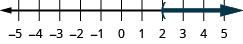
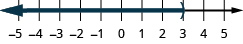
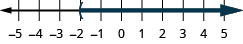
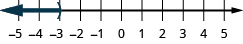
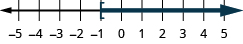
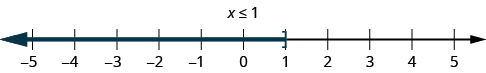
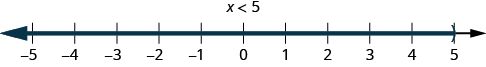
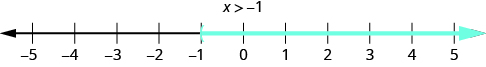
Graph on the number line:
ⓐ ⓑ ⓒ
We can also represent inequalities using interval notation. As we saw above, the inequality means all numbers greater than 3. There is no upper end to the solution to this inequality. In interval notation , we express as The symbol is read as ‘infinity’. It is not an actual number. [link] shows both the number line and the interval notation.
Notification Switch
Would you like to follow the 'Elementary algebra' conversation and receive update notifications?

|
|

|
|

|
|

|
|

|
|

|
|

|
|

|
|

|
|

|