| << Chapter < Page | Chapter >> Page > |
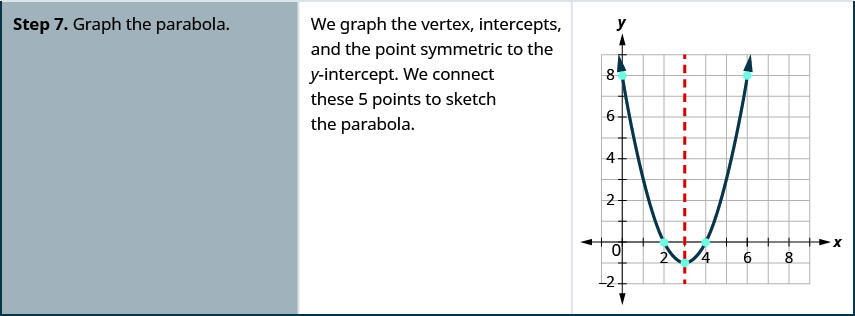
Now, we have all the pieces we need in order to graph a quadratic equation in two variables. We just need to put them together. In the next example, we will see how to do this.
We were able to find the x -intercepts in the last example by factoring. We find the x -intercepts in the next example by factoring, too.
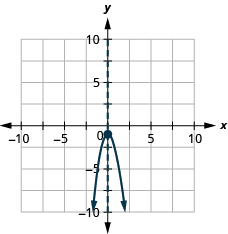
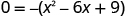
Graph .
| The equation y has on one side. |
 | |
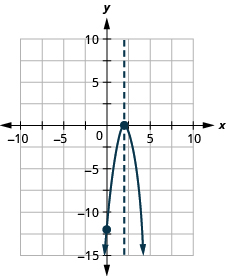
| Since
a is
, the parabola opens downward.
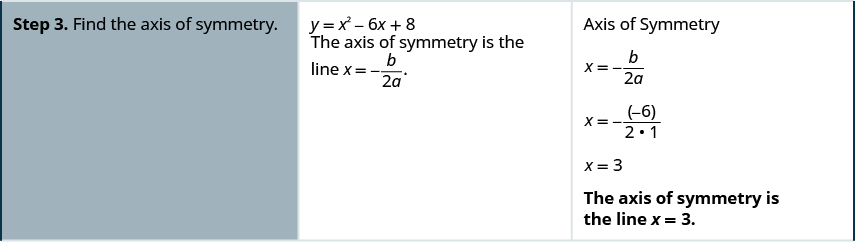
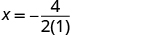
To find the axis of symmetry, find . |
 |

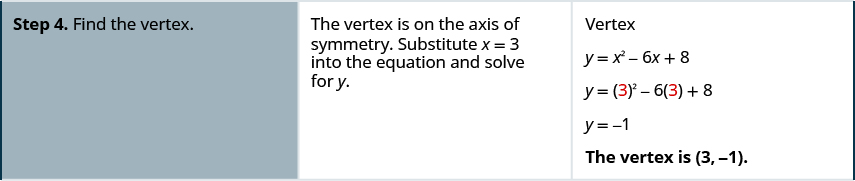
The axis of symmetry is The vertex is on the line 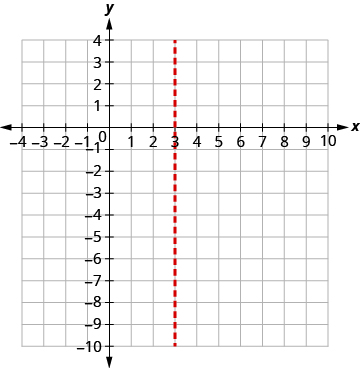 |
| Find y when |
The vertex is 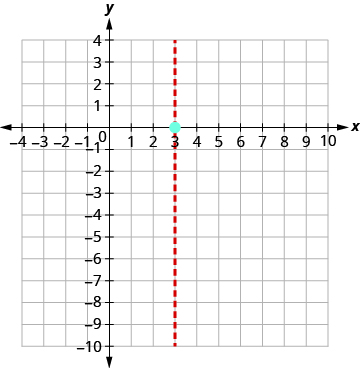 | |
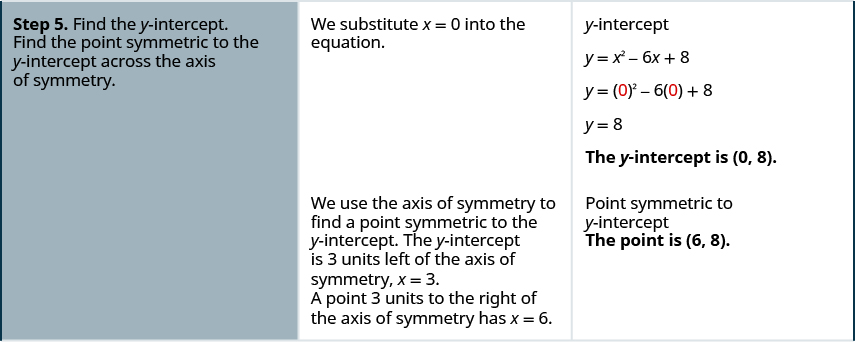
| The
y -intercept occurs when
Substitute Simplify. The point is three units to the left of the line of symmetry. The point three units to the right of the line of symmetry is Point symmetric to the y- intercept is |

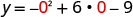
The y -intercept is 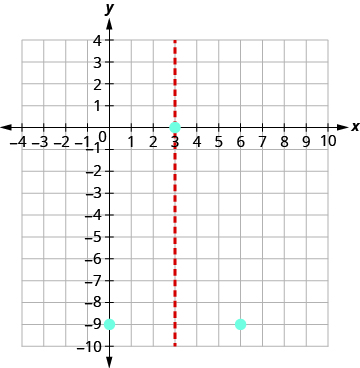 | |
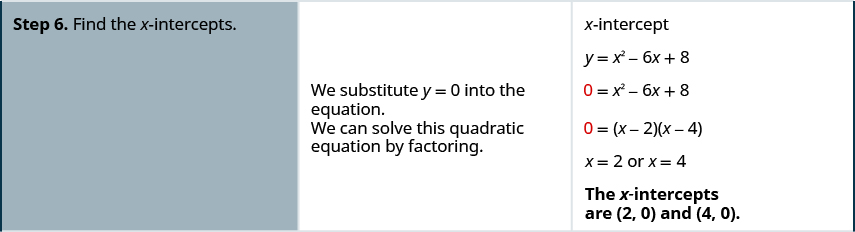
| The x -intercept occurs when |
 | |
| Substitute |
 | |
| Factor the GCF. |
 | |
| Factor the trinomial. |
 | |
| Solve for x . |
 | |
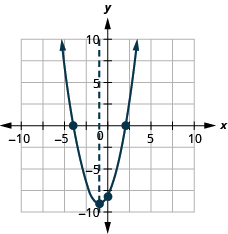
| Connect the points to graph the parabola. |
 |
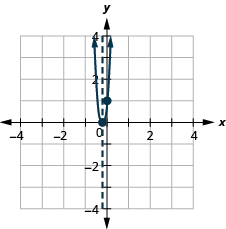
For the graph of , the vertex and the x -intercept were the same point. Remember how the discriminant determines the number of solutions of a quadratic equation? The discriminant of the equation is 0, so there is only one solution. That means there is only one x -intercept, and it is the vertex of the parabola.
How many x -intercepts would you expect to see on the graph of ?
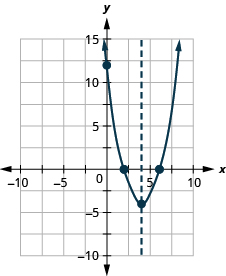
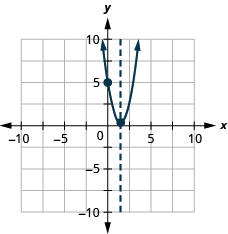
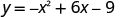
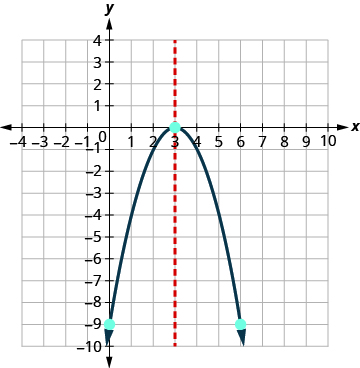
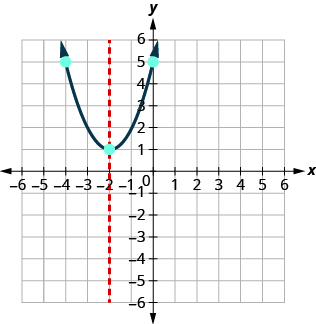
Graph .
| The equation has y on one side. |
 | |
| Since a is 1, the parabola opens upward. |
 | |
| To find the axis of symmetry, find |

The axis of symmetry is 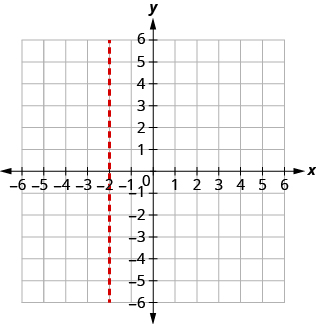 | |
| The vertex is on the line | ||
| Find y when |

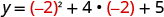
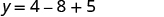
The vertex is  | |
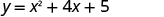
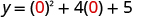
| The
y -intercept occurs when
Substitute Simplify. The point is two units to the right of the line of symmetry. The point two units to the left of the line of symmetry is |
The y -intercept is 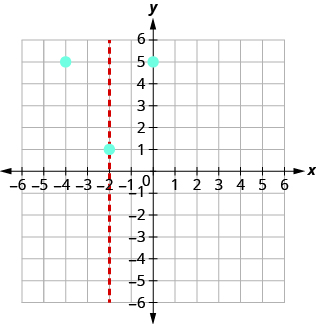
Point symmetric to the y- intercept is . | |
| The x - intercept occurs when | ||
| Substitute
Test the discriminant. |
 | |
|
| ||
| Since the value of the discriminant is negative, there is no solution and so no
x- intercept.
Connect the points to graph the parabola. You may want to choose two more points for greater accuracy. |
 |
Notification Switch
Would you like to follow the 'Elementary algebra' conversation and receive update notifications?

|
|

|
|

|
|

|
|
|
|
|

|
|

|
|

|
|

|
|

|