<< Chapter < Page Chapter >> Page >
Graph of a cubic function.

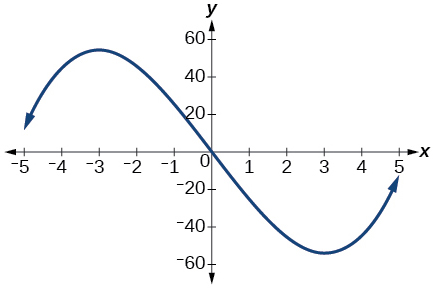
Estimate the intervals where the function is increasing or decreasing.

Got questions? Get instant answers now!

Estimate the point(s) at which the graph of f has a local maximum or a local minimum.

local maximum: ( 3 ,   60 ) , local minimum: ( 3 ,   60 )

Got questions? Get instant answers now!

For the following exercises, consider the graph in [link] .

Graph of a cubic function.

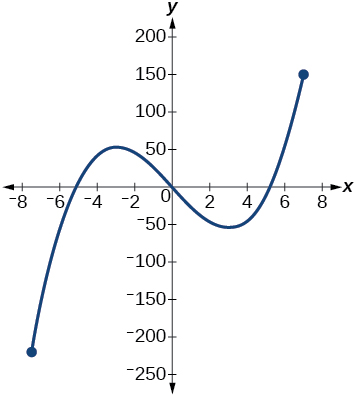
If the complete graph of the function is shown, estimate the intervals where the function is increasing or decreasing.

Got questions? Get instant answers now!

If the complete graph of the function is shown, estimate the absolute maximum and absolute minimum.

absolute maximum at approximately ( 7 ,   150 ) , absolute minimum at approximately ( −7.5 ,   −220 )

Got questions? Get instant answers now!

Numeric

[link] gives the annual sales (in millions of dollars) of a product from 1998 to 2006. What was the average rate of change of annual sales (a) between 2001 and 2002, and (b) between 2001 and 2004?

Year Sales
(millions of dollars)
1998 201
1999 219
2000 233
2001 243
2002 249
2003 251
2004 249
2005 243
2006 233
Got questions? Get instant answers now!

[link] gives the population of a town (in thousands) from 2000 to 2008. What was the average rate of change of population (a) between 2002 and 2004, and (b) between 2002 and 2006?

Year Population
(thousands)
2000 87
2001 84
2002 83
2003 80
2004 77
2005 76
2006 78
2007 81
2008 85

a. –3000; b. –1250

Got questions? Get instant answers now!

For the following exercises, find the average rate of change of each function on the interval specified.

f ( x ) = x 2 on [ 1 ,   5 ]

Got questions? Get instant answers now!

h ( x ) = 5 2 x 2 on [ −2 , 4 ]

-4

Got questions? Get instant answers now!

q ( x ) = x 3 on [ −4 , 2 ]

Got questions? Get instant answers now!

g ( x ) = 3 x 3 1 on [ −3 , 3 ]

27

Got questions? Get instant answers now!

y = 1 x on [ 1 ,  3 ]

Got questions? Get instant answers now!

p ( t ) = ( t 2 4 ) ( t + 1 ) t 2 + 3 on [ −3 , 1 ]

–0.167

Got questions? Get instant answers now!

k ( t ) = 6 t 2 + 4 t 3 on [ −1 , 3 ]

Got questions? Get instant answers now!

Technology

For the following exercises, use a graphing utility to estimate the local extrema of each function and to estimate the intervals on which the function is increasing and decreasing.

f ( x ) = x 4 4 x 3 + 5

Local minimum at ( 3 , 22 ) , decreasing on ( ,   3 ) , increasing on ( 3 ,   )

Got questions? Get instant answers now!

h ( x ) = x 5 + 5 x 4 + 10 x 3 + 10 x 2 1

Got questions? Get instant answers now!

g ( t ) = t t + 3

Local minimum at ( 2 , 2 ) , decreasing on ( 3 , 2 ) , increasing on ( 2 ,   )

Got questions? Get instant answers now!

m ( x ) = x 4 + 2 x 3 12 x 2 10 x + 4

Local maximum at ( 0.5 ,   6 ) , local minima at ( 3.25 , 47 ) and ( 2.1 , 32 ) , decreasing on ( , 3.25 ) and ( 0.5 ,   2.1 ) , increasing on ( 3.25 ,   0.5 ) and ( 2.1 ,   )

Got questions? Get instant answers now!

n ( x ) = x 4 8 x 3 + 18 x 2 6 x + 2

Got questions? Get instant answers now!

Extension

The graph of the function f is shown in [link] .

Graph of f(x) on a graphing calculator.

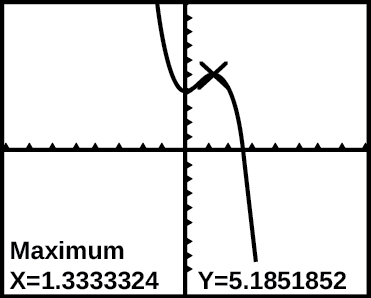
Based on the calculator screen shot, the point ( 1.333 ,   5.185 ) is which of the following?

  1. a relative (local) maximum of the function
  2. the vertex of the function
  3. the absolute maximum of the function
  4. a zero of the function

A

Got questions? Get instant answers now!

Let f ( x ) = 1 x . Find a number c such that the average rate of change of the function f on the interval ( 1 , c ) is 1 4 .

Got questions? Get instant answers now!

Let f ( x ) = 1 x . Find the number b such that the average rate of change of f on the interval ( 2 , b ) is 1 10 .

b = 5

Got questions? Get instant answers now!

Real-world applications

At the start of a trip, the odometer on a car read 21,395. At the end of the trip, 13.5 hours later, the odometer read 22,125. Assume the scale on the odometer is in miles. What is the average speed the car traveled during this trip?

Got questions? Get instant answers now!

A driver of a car stopped at a gas station to fill up his gas tank. He looked at his watch, and the time read exactly 3:40 p.m. At this time, he started pumping gas into the tank. At exactly 3:44, the tank was full and he noticed that he had pumped 10.7 gallons. What is the average rate of flow of the gasoline into the gas tank?

2.7 gallons per minute

Got questions? Get instant answers now!

Near the surface of the moon, the distance that an object falls is a function of time. It is given by d ( t ) = 2.6667 t 2 , where t is in seconds and d ( t ) is in feet. If an object is dropped from a certain height, find the average velocity of the object from t = 1 to t = 2.

Got questions? Get instant answers now!

The graph in [link] illustrates the decay of a radioactive substance over t days.

Graph of an exponential function.

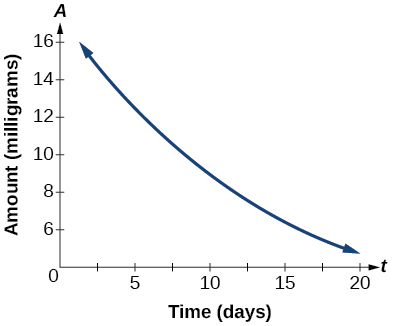
Use the graph to estimate the average decay rate from t = 5 to t = 15.

approximately –0.6 milligrams per day

Got questions? Get instant answers now!

Questions & Answers

how do you get the 2/50
Abba Reply
number of sport play by 50 student construct discrete data
Aminu Reply
width of the frangebany leaves on how to write a introduction
Theresa Reply
Solve the mean of variance
Veronica Reply
Step 1: Find the mean. To find the mean, add up all the scores, then divide them by the number of scores. ... Step 2: Find each score's deviation from the mean. ... Step 3: Square each deviation from the mean. ... Step 4: Find the sum of squares. ... Step 5: Divide the sum of squares by n – 1 or N.
kenneth
what is error
Yakuba Reply
Is mistake done to something
Vutshila
Hy
anas
hy
What is the life teble
anas
hy
Jibrin
statistics is the analyzing of data
Tajudeen Reply
what is statics?
Zelalem Reply
how do you calculate mean
Gloria Reply
diveving the sum if all values
Shaynaynay
let A1,A2 and A3 events be independent,show that (A1)^c, (A2)^c and (A3)^c are independent?
Fisaye Reply
what is statistics
Akhisani Reply
data collected all over the world
Shaynaynay
construct a less than and more than table
Imad Reply
The sample of 16 students is taken. The average age in the sample was 22 years with astandard deviation of 6 years. Construct a 95% confidence interval for the age of the population.
Aschalew Reply
Bhartdarshan' is an internet-based travel agency wherein customer can see videos of the cities they plant to visit. The number of hits daily is a normally distributed random variable with a mean of 10,000 and a standard deviation of 2,400 a. what is the probability of getting more than 12,000 hits? b. what is the probability of getting fewer than 9,000 hits?
Akshay Reply
Bhartdarshan'is an internet-based travel agency wherein customer can see videos of the cities they plan to visit. The number of hits daily is a normally distributed random variable with a mean of 10,000 and a standard deviation of 2,400. a. What is the probability of getting more than 12,000 hits
Akshay
1
Bright
Sorry i want to learn more about this question
Bright
Someone help
Bright
a= 0.20233 b=0.3384
Sufiyan
a
Shaynaynay
How do I interpret level of significance?
Mohd Reply
It depends on your business problem or in Machine Learning you could use ROC- AUC cruve to decide the threshold value
Shivam
how skewness and kurtosis are used in statistics
Owen Reply
yes what is it
Taneeya
Got questions? Join the online conversation and get instant answers!
Jobilize.com Reply
Practice Key Terms 9

Get Jobilize Job Search Mobile App in your pocket Now!

Get it on Google Play Download on the App Store Now


Source:  OpenStax, College algebra. OpenStax CNX. Feb 06, 2015 Download for free at https://legacy.cnx.org/content/col11759/1.3
Google Play and the Google Play logo are trademarks of Google Inc.

Notification Switch

Would you like to follow the 'College algebra' conversation and receive update notifications?

Ask