Given the polar equation for a conic, identify the type of conic, the directrix, and the eccentricity.
Multiply the numerator and denominator by the reciprocal of the constant in the denominator to rewrite the equation in standard form.
Identify the eccentricity
as the coefficient of the trigonometric function in the denominator.
Compare
with 1 to determine the shape of the conic.
Determine the directrix as
if cosine is in the denominator and
if sine is in the denominator. Set
equal to the numerator in standard form to solve for
or
Identifying a conic given the polar form
For each of the following equations, identify the conic with focus at the origin, the
directrix , and the
eccentricity .
For each of the three conics, we will rewrite the equation in standard form. Standard form has a 1 as the constant in the denominator. Therefore, in all three parts, the first step will be to multiply the numerator and denominator by the reciprocal of the constant of the original equation,
where
is that constant.
Multiply the numerator and denominator by
Because
is in the denominator, the directrix is
Comparing to standard form, note that
Therefore, from the numerator,
Since
the conic is an
ellipse . The eccentricity is
and the directrix is
Multiply the numerator and denominator by
Because
is in the denominator, the directrix is
Comparing to standard form,
Therefore, from the numerator,
Since
the conic is a
hyperbola . The eccentricity is
and the directrix is
Multiply the numerator and denominator by
Because sine is in the denominator, the directrix is
Comparing to standard form,
Therefore, from the numerator,
Because
the conic is a
parabola . The eccentricity is
and the directrix is
When graphing in Cartesian coordinates, each conic section has a unique equation. This is not the case when graphing in polar coordinates. We must use the eccentricity of a conic section to determine which type of curve to graph, and then determine its specific characteristics. The first step is to rewrite the conic in standard form as we have done in the previous example. In other words, we need to rewrite the equation so that the denominator begins with 1. This enables us to determine
and, therefore, the shape of the curve. The next step is to substitute values for
and solve for
to plot a few key points. Setting
equal to
and
provides the vertices so we can create a rough sketch of the graph.
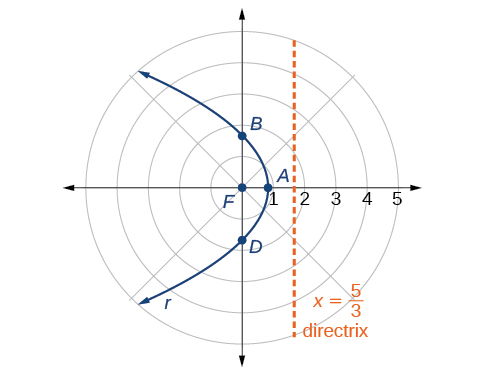
Graphing a parabola in polar form
Graph
First, we rewrite the conic in standard form by multiplying the numerator and denominator by the reciprocal of 3, which is
Because
we will graph a
parabola with a focus at the origin. The function has a
and there is an addition sign in the denominator, so the directrix is
The directrix is
Plotting a few key points as in
[link] will enable us to see the vertices. See
[link] .
Step 1: Find the mean. To find the mean, add up all the scores, then divide them by the number of scores. ...
Step 2: Find each score's deviation from the mean. ...
Step 3: Square each deviation from the mean. ...
Step 4: Find the sum of squares. ...
Step 5: Divide the sum of squares by n – 1 or N.
The sample of 16 students is taken. The average age in the sample was 22 years with astandard deviation of 6 years. Construct a 95% confidence interval for the age of the population.
Bhartdarshan' is an internet-based travel agency wherein customer can see videos of the cities they plant to visit. The number of hits daily is a normally distributed random variable with a mean of 10,000 and a standard deviation of 2,400
a. what is the probability of getting more than 12,000 hits?
b. what is the probability of getting fewer than 9,000 hits?
Bhartdarshan'is an internet-based travel agency wherein customer can see videos of the cities they plan to visit. The number of hits daily is a normally distributed random variable with a mean of 10,000 and a standard deviation of 2,400.
a. What is the probability of getting more than 12,000 hits