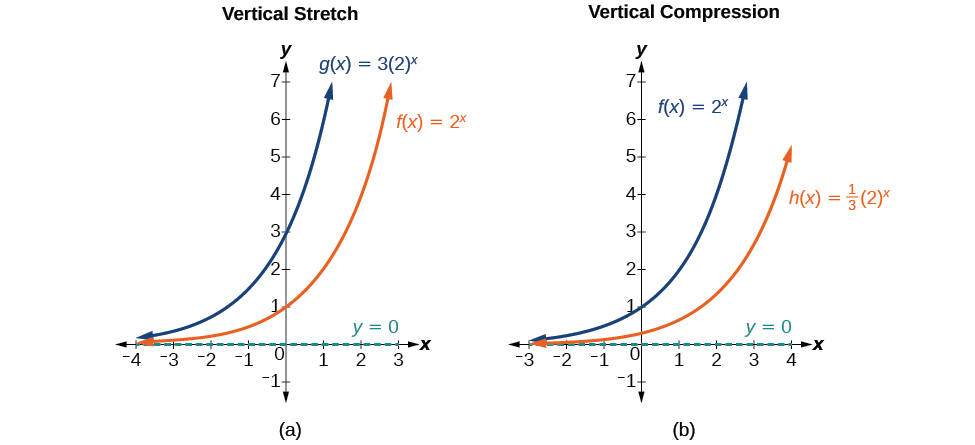
(a)
stretches the graph of
vertically by a factor of
(b)
compresses the graph of
vertically by a factor of
Stretches and compressions of the parent function
f (
x ) =
bx
For any factor
the function
is stretched vertically by a factor of
if
is compressed vertically by a factor of
if
has a
y -intercept of
has a horizontal asymptote at
a range of
and a domain of
which are unchanged from the parent function.
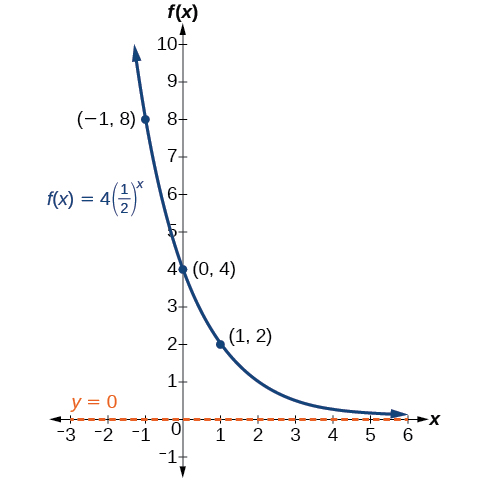
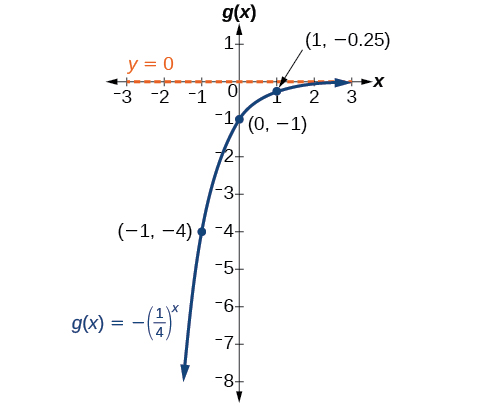
Graphing the stretch of an exponential function
Sketch a graph of
State the domain, range, and asymptote.
Before graphing, identify the behavior and key points on the graph.
Since
is between zero and one, the left tail of the graph will increase without bound as
decreases, and the right tail will approach the
x -axis as
increases.
Since
the graph of
will be stretched by a factor of
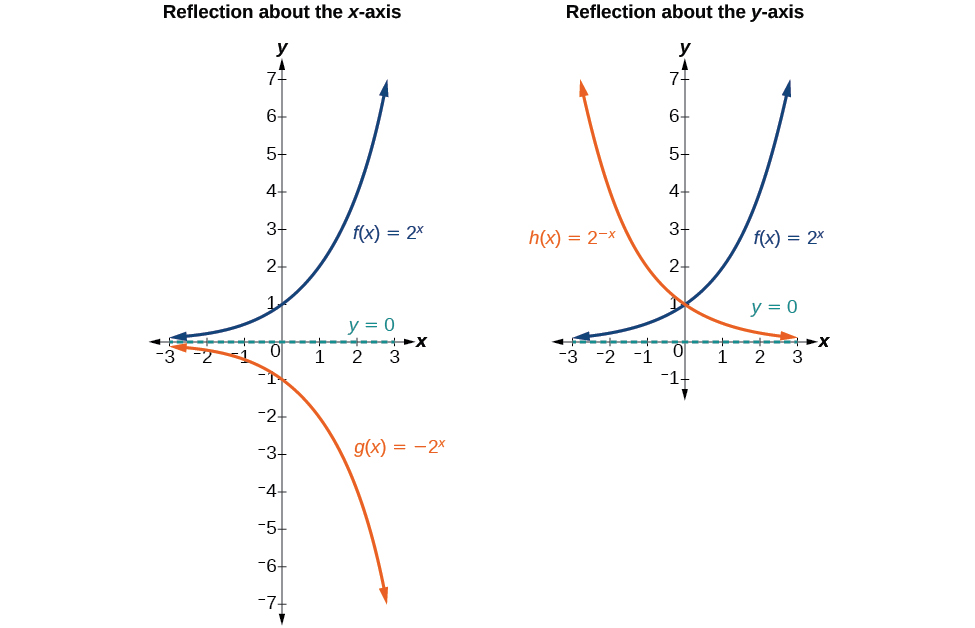
In addition to shifting, compressing, and stretching a graph, we can also reflect it about the
x -axis or the
y -axis. When we multiply the parent function
by
we get a reflection about the
x -axis. When we multiply the input by
we get a
reflection about the
y -axis. For example, if we begin by graphing the parent function
we can then graph the two reflections alongside it. The reflection about the
x -axis,
is shown on the left side of
[link] , and the reflection about the
y -axis
is shown on the right side of
[link] .
(a)
reflects the graph of
about the x-axis. (b)
reflects the graph of
about the
y -axis.
Reflections of the parent function
f (
x ) =
bx
The function
reflects the parent function
about the
x -axis.
has a
y -intercept of
has a range of
has a horizontal asymptote at
and domain of
which are unchanged from the parent function.
The function
reflects the parent function
about the
y -axis.
has a
y -intercept of
a horizontal asymptote at
a range of
and a domain of
which are unchanged from the parent function.
Writing and graphing the reflection of an exponential function
Find and graph the equation for a function,
that reflects
about the
x -axis. State its domain, range, and asymptote.
Since we want to reflect the parent function
about the
x- axis, we multiply
by
to get,
Next we create a table of points as in
[link] .
Plot the
y- intercept,
along with two other points. We can use
and
Draw a smooth curve connecting the points:
The domain is
the range is
the horizontal asymptote is
is it possible to leave every good at the same level
Joseph
I don't think so. because check it, if the demand for chicken increases, people will no longer consume fish like they used to causing a fall in the demand for fish
Anuolu
is not really possible to let the value of a goods to be same at the same time.....
Salome
Suppose the inflation rate is 6%, does it mean that all the goods you purchase will cost
6% more than previous year? Provide with reasoning.
Not necessarily. To measure the inflation rate economists normally use an averaged price index of a basket of certain goods. So if you purchase goods included in the basket, you will notice that you pay 6% more, otherwise not necessarily.
Good day
How do I calculate this question: C= 100+5yd G= 2000 T= 2000 I(planned)=200.
Suppose the actual output is 3000. What is the level of planned expenditures at this level of output?
I am Camara from Guinea west Africa... happy to meet you guys here
Sekou
ma management ho
Amisha
ahile becheclor ho
Amisha
hjr ktm bta ho
ani k kaam grnu hunxa tw
Amisha
belatari
Amisha
1st year ho
Amisha
nd u
Amisha
ahh
Amisha
kaha biratnagar
Amisha
ys
Amisha
kina k vo
Amisha
money as unit of account means what?
Kalombe
A unit of account is something that can be used to value goods and services and make calculations
Jim
all of you please speak in English I can't understand you're language
Muhammad
I want to know how can we define macroeconomics in one line
Muhammad
it must be .9 or 0.9
no Mpc is greater than 1
Y=100+.9Y+50
Y-.9Y=150
0.1Y/0.1=150/0.1
Y=1500
Kalombe
Mercy is it clear?😋
Kalombe
hi can someone help me on this question
If a negative shocks shifts the IS curve to the left, what type of policy do you suggest so as to stabilize the level of output?
discuss your answer using appropriate graph.