

| << Chapter < Page | Chapter >> Page > |
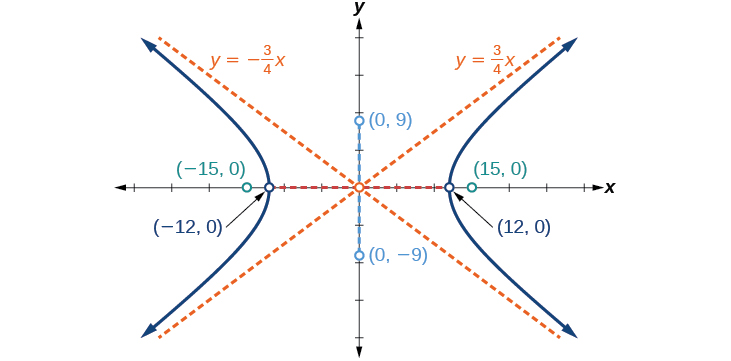
Graph the hyperbola given by the equation Identify and label the vertices, co-vertices, foci, and asymptotes.
vertices: co-vertices: foci: asymptotes:
Graphing hyperbolas centered at a point other than the origin is similar to graphing ellipses centered at a point other than the origin. We use the standard forms for horizontal hyperbolas, and for vertical hyperbolas. From these standard form equations we can easily calculate and plot key features of the graph: the coordinates of its center, vertices, co-vertices, and foci; the equations of its asymptotes; and the positions of the transverse and conjugate axes.
Given a general form for a hyperbola centered at sketch the graph.
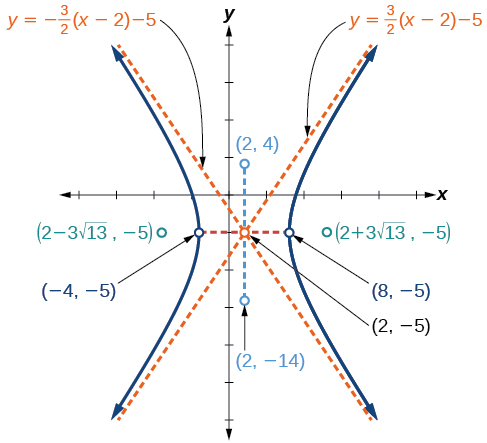
Graph the hyperbola given by the equation Identify and label the center, vertices, co-vertices, foci, and asymptotes.
Start by expressing the equation in standard form. Group terms that contain the same variable, and move the constant to the opposite side of the equation.
Factor the leading coefficient of each expression.
Complete the square twice. Remember to balance the equation by adding the same constants to each side.
Rewrite as perfect squares.
Divide both sides by the constant term to place the equation in standard form.
The standard form that applies to the given equation is where and or and Thus, the transverse axis is parallel to the x -axis. It follows that:
Therefore, the coordinates of the foci are and
The equations of the asymptotes are
Next, we plot and label the center, vertices, co-vertices, foci, and asymptotes and draw smooth curves to form the hyperbola, as shown in [link] .
Notification Switch
Would you like to follow the 'College algebra' conversation and receive update notifications?

|
|
|
|
|

|
|

|
|

|
|

|
|

|
|

|
|

|
|
|
|
|
|
|
|

|