Just as we can write the equation for an ellipse given its graph, we can graph an ellipse given its equation. To graph ellipses centered at the origin, we use the standard form
for horizontal ellipses and
for vertical ellipses.
Given the standard form of an equation for an ellipse centered at
sketch the graph.
Use the standard forms of the equations of an ellipse to determine the major axis, vertices, co-vertices, and foci.
If the equation is in the form
where
then
the major axis is the
x -axis
the coordinates of the vertices are
the coordinates of the co-vertices are
the coordinates of the foci are
If the equation is in the form
where
then
the major axis is the
y -axis
the coordinates of the vertices are
the coordinates of the co-vertices are
the coordinates of the foci are
Solve for
using the equation
Plot the center, vertices, co-vertices, and foci in the coordinate plane, and draw a smooth curve to form the ellipse.
Graphing an ellipse centered at the origin
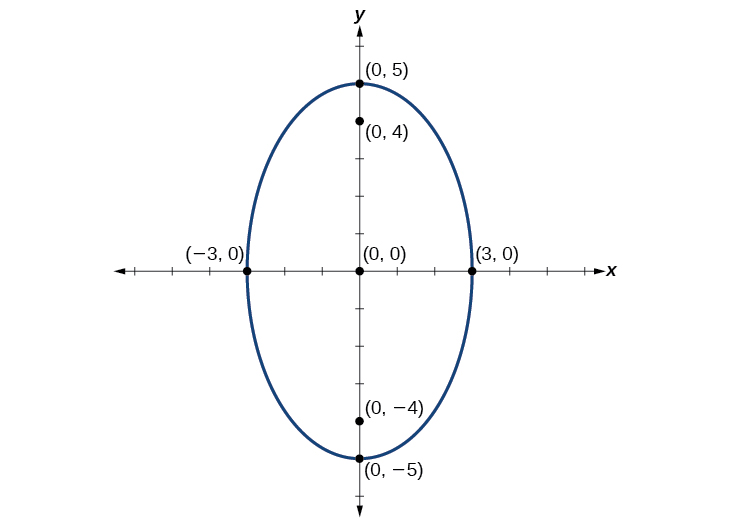
Graph the ellipse given by the equation,
Identify and label the center, vertices, co-vertices, and foci.
First, we determine the position of the major axis. Because
the major axis is on the
y -axis. Therefore, the equation is in the form
where
and
It follows that:
the center of the ellipse is
the coordinates of the vertices are
the coordinates of the co-vertices are
the coordinates of the foci are
where
Solving for
we have:
Therefore, the coordinates of the foci are
Next, we plot and label the center, vertices, co-vertices, and foci, and draw a smooth curve to form the ellipse. See
[link] .
Graphing an ellipse centered at the origin from an equation not in standard form
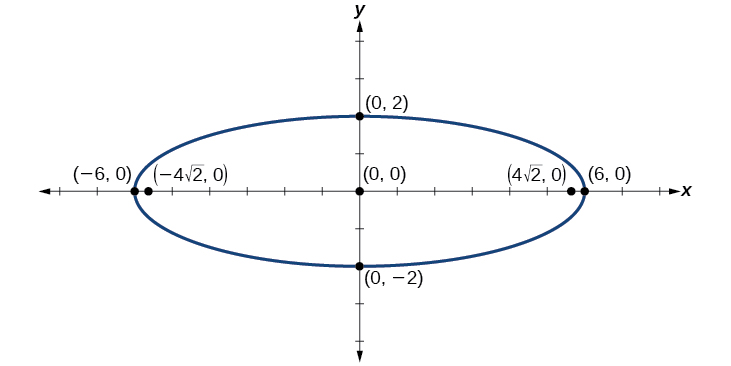
Graph the ellipse given by the equation
Rewrite the equation in standard form. Then identify and label the center, vertices, co-vertices, and foci.
First, use algebra to rewrite the equation in standard form.
Next, we determine the position of the major axis. Because
the major axis is on the
x -axis. Therefore, the equation is in the form
where
and
It follows that:
the center of the ellipse is
the coordinates of the vertices are
the coordinates of the co-vertices are
the coordinates of the foci are
where
Solving for
we have:
Therefore the coordinates of the foci are
Next, we plot and label the center, vertices, co-vertices, and foci, and draw a smooth curve to form the ellipse.
Step 1: Find the mean. To find the mean, add up all the scores, then divide them by the number of scores. ...
Step 2: Find each score's deviation from the mean. ...
Step 3: Square each deviation from the mean. ...
Step 4: Find the sum of squares. ...
Step 5: Divide the sum of squares by n – 1 or N.
The sample of 16 students is taken. The average age in the sample was 22 years with astandard deviation of 6 years. Construct a 95% confidence interval for the age of the population.
Bhartdarshan' is an internet-based travel agency wherein customer can see videos of the cities they plant to visit. The number of hits daily is a normally distributed random variable with a mean of 10,000 and a standard deviation of 2,400
a. what is the probability of getting more than 12,000 hits?
b. what is the probability of getting fewer than 9,000 hits?
Bhartdarshan'is an internet-based travel agency wherein customer can see videos of the cities they plan to visit. The number of hits daily is a normally distributed random variable with a mean of 10,000 and a standard deviation of 2,400.
a. What is the probability of getting more than 12,000 hits