Now that we have learned to graph nonlinear inequalities, we can learn how to graph systems of nonlinear inequalities. A
system of nonlinear inequalities is a system of two or more inequalities in two or more variables containing at least one inequality that is not linear. Graphing a system of nonlinear inequalities is similar to graphing a system of linear inequalities. The difference is that our graph may result in more shaded regions that represent a solution than we find in a system of linear inequalities. The solution to a nonlinear system of inequalities is the region of the graph where the shaded regions of the graph of each inequality overlap, or where the regions intersect, called the
feasible region .
Given a system of nonlinear inequalities, sketch a graph.
Find the intersection points by solving the corresponding system of nonlinear equations.
Graph the nonlinear equations.
Find the shaded regions of each inequality.
Identify the feasible region as the intersection of the shaded regions of each inequality or the set of points common to each inequality.
Graphing a system of inequalities
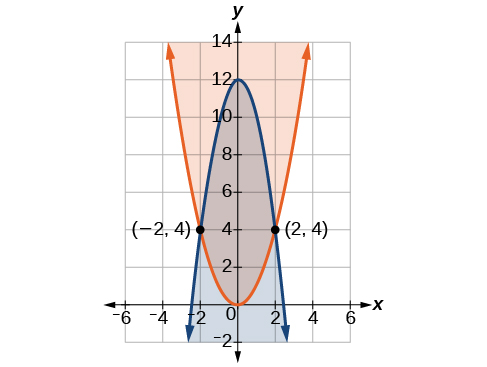
Graph the given system of inequalities.
These two equations are clearly parabolas. We can find the points of intersection by the elimination process: Add both equations and the variable
will be eliminated. Then we solve for
Substitute the
x -values into one of the equations and solve for
The two points of intersection are
and
Notice that the equations can be rewritten as follows.
Graph each inequality. See
[link] . The feasible region is the region between the two equations bounded by
on the top and
on the bottom.
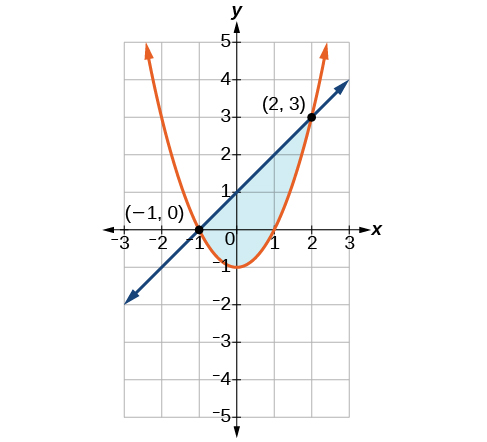
There are three possible types of solutions to a system of equations representing a line and a parabola: (1) no solution, the line does not intersect the parabola; (2) one solution, the line is tangent to the parabola; and (3) two solutions, the line intersects the parabola in two points. See
[link] .
There are three possible types of solutions to a system of equations representing a circle and a line: (1) no solution, the line does not intersect the circle; (2) one solution, the line is tangent to the parabola; (3) two solutions, the line intersects the circle in two points. See
[link] .
There are five possible types of solutions to the system of nonlinear equations representing an ellipse and a circle:
(1) no solution, the circle and the ellipse do not intersect; (2) one solution, the circle and the ellipse are tangent to each other; (3) two solutions, the circle and the ellipse intersect in two points; (4) three solutions, the circle and ellipse intersect in three places; (5) four solutions, the circle and the ellipse intersect in four points. See
[link] .
An inequality is graphed in much the same way as an equation, except for>or<, we draw a dashed line and shade the region containing the solution set. See
[link] .
Inequalities are solved the same way as equalities, but solutions to systems of inequalities must satisfy both inequalities. See
[link] .
is it possible to leave every good at the same level
Joseph
I don't think so. because check it, if the demand for chicken increases, people will no longer consume fish like they used to causing a fall in the demand for fish
Anuolu
is not really possible to let the value of a goods to be same at the same time.....
Salome
Suppose the inflation rate is 6%, does it mean that all the goods you purchase will cost
6% more than previous year? Provide with reasoning.
Not necessarily. To measure the inflation rate economists normally use an averaged price index of a basket of certain goods. So if you purchase goods included in the basket, you will notice that you pay 6% more, otherwise not necessarily.
Good day
How do I calculate this question: C= 100+5yd G= 2000 T= 2000 I(planned)=200.
Suppose the actual output is 3000. What is the level of planned expenditures at this level of output?
I am Camara from Guinea west Africa... happy to meet you guys here
Sekou
ma management ho
Amisha
ahile becheclor ho
Amisha
hjr ktm bta ho
ani k kaam grnu hunxa tw
Amisha
belatari
Amisha
1st year ho
Amisha
nd u
Amisha
ahh
Amisha
kaha biratnagar
Amisha
ys
Amisha
kina k vo
Amisha
money as unit of account means what?
Kalombe
A unit of account is something that can be used to value goods and services and make calculations
Jim
all of you please speak in English I can't understand you're language
Muhammad
I want to know how can we define macroeconomics in one line
Muhammad
it must be .9 or 0.9
no Mpc is greater than 1
Y=100+.9Y+50
Y-.9Y=150
0.1Y/0.1=150/0.1
Y=1500
Kalombe
Mercy is it clear?😋
Kalombe
hi can someone help me on this question
If a negative shocks shifts the IS curve to the left, what type of policy do you suggest so as to stabilize the level of output?
discuss your answer using appropriate graph.