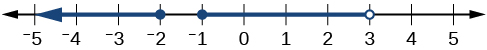
Describe the intervals of values shown in
[link] using inequality notation, set-builder notation, and interval notation.
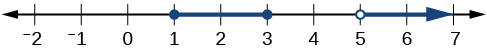
To describe the values,
included in the intervals shown, we would say, “
is a real number greater than or equal to 1 and less than or equal to 3, or a real number greater than 5.”
Inequality
Set-builder notation
Interval notation
Remember that, when writing or reading interval notation, using a square bracket means the boundary is included in the set. Using a parenthesis means the boundary is not included in the set.
Another way to identify the domain and range of functions is by using graphs. Because the domain refers to the set of possible input values, the domain of a graph consists of all the input values shown on the
x -axis. The range is the set of possible output values, which are shown on the
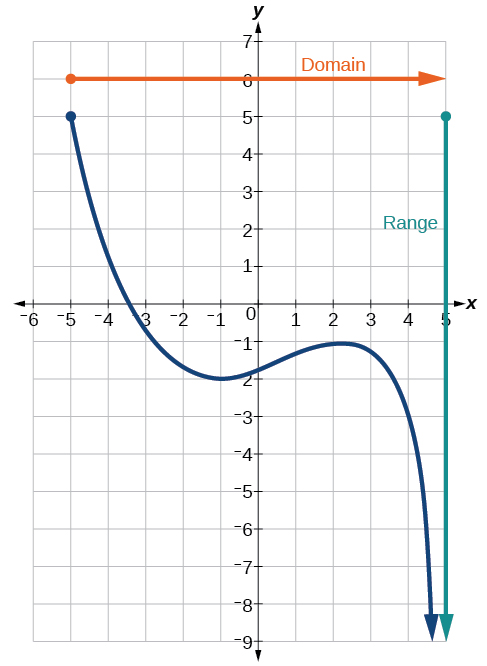
y -axis. Keep in mind that if the graph continues beyond the portion of the graph we can see, the domain and range may be greater than the visible values. See
[link] .
We can observe that the graph extends horizontally from
to the right without bound, so the domain is
The vertical extent of the graph is all range values
and below, so the range is
Note that the domain and range are always written from smaller to larger values, or from left to right for domain, and from the bottom of the graph to the top of the graph for range.
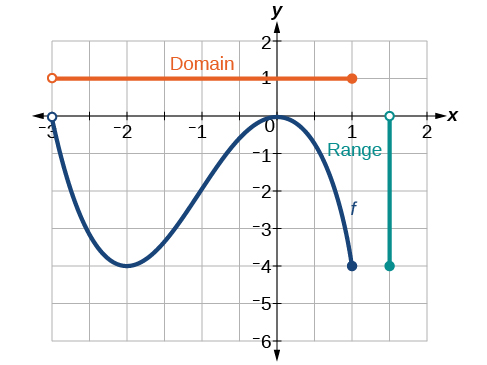
Finding domain and range from a graph
Find the domain and range of the function
whose graph is shown in
[link] .
We can observe that the horizontal extent of the graph is –3 to 1, so the domain of
is
The vertical extent of the graph is 0 to –4, so the range is
See
[link] .
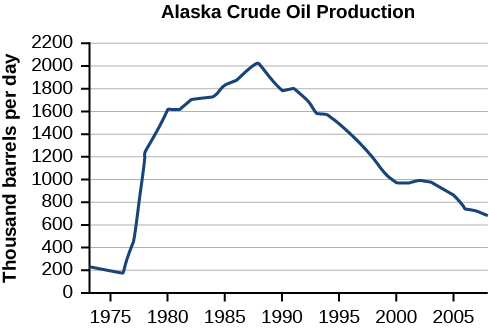
Finding domain and range from a graph of oil production
Find the domain and range of the function
whose graph is shown in
[link] .
(credit: modification of work by the U.S. Energy Information Administration)
http://www.eia.gov/dnav/pet/hist/LeafHandler.ashx?n=PET&s=MCRFPAK2&f=A.
The input quantity along the horizontal axis is “years,” which we represent with the variable
for time. The output quantity is “thousands of barrels of oil per day,” which we represent with the variable
for barrels. The graph may continue to the left and right beyond what is viewed, but based on the portion of the graph that is visible, we can determine the domain as
and the range as approximately
In interval notation, the domain is [1973, 2008], and the range is about [180, 2010]. For the domain and the range, we approximate the smallest and largest values since they do not fall exactly on the grid lines.
A golfer on a fairway is 70 m away from the green, which sits below the level of the fairway by 20 m. If the golfer hits the ball at an angle of 40° with an initial speed of 20 m/s, how close to the green does she come?
A mouse of mass 200 g falls 100 m down a vertical mine shaft and lands at the bottom with a speed of 8.0 m/s. During its fall, how much work is done on the mouse by air resistance
Chemistry is a branch of science that deals with the study of matter,it composition,it structure and the changes it undergoes
Adjei
please, I'm a physics student and I need help in physics
Adjanou
chemistry could also be understood like the sexual attraction/repulsion of the male and female elements. the reaction varies depending on the energy differences of each given gender. + masculine -female.
Pedro
A ball is thrown straight up.it passes a 2.0m high window 7.50 m off the ground on it path up and takes 1.30 s to go past the window.what was the ball initial velocity
2. A sled plus passenger with total mass 50 kg is pulled 20 m across the snow (0.20) at constant velocity by a force directed 25° above the horizontal. Calculate (a) the work of the applied force, (b) the work of friction, and (c) the total work.
you have been hired as an espert witness in a court case involving an automobile accident. the accident involved car A of mass 1500kg which crashed into stationary car B of mass 1100kg. the driver of car A applied his brakes 15 m before he skidded and crashed into car B. after the collision, car A s
can someone explain to me, an ignorant high school student, why the trend of the graph doesn't follow the fact that the higher frequency a sound wave is, the more power it is, hence, making me think the phons output would follow this general trend?
Nevermind i just realied that the graph is the phons output for a person with normal hearing and not just the phons output of the sound waves power, I should read the entire thing next time
Joseph
Follow up question, does anyone know where I can find a graph that accuretly depicts the actual relative "power" output of sound over its frequency instead of just humans hearing
Joseph
"Generation of electrical energy from sound energy | IEEE Conference Publication | IEEE Xplore" ***ieeexplore.ieee.org/document/7150687?reload=true
A string is 3.00 m long with a mass of 5.00 g. The string is held taut with a tension of 500.00 N applied to the string. A pulse is sent down the string. How long does it take the pulse to travel the 3.00 m of the string?


![Graph of a function from (-3, 1].](/ocw/mirror/col11759/m51262/CNX_Precalc_Figure_01_02_007.jpg)