<< Chapter < Page Chapter >> Page >
  • Let b = 1. Then f ( x ) = 1 x = 1 for any value of x .

To evaluate an exponential function with the form f ( x ) = b x , we simply substitute x with the given value, and calculate the resulting power. For example:

Let f ( x ) = 2 x . What is f ( 3 ) ?

f ( x ) = 2 x f ( 3 ) = 2 3   Substitute  x = 3. = 8   Evaluate the power .

To evaluate an exponential function with a form other than the basic form, it is important to follow the order of operations. For example:

Let f ( x ) = 30 ( 2 ) x . What is f ( 3 ) ?

f ( x ) = 30 ( 2 ) x f ( 3 ) = 30 ( 2 ) 3 Substitute  x = 3. = 30 ( 8 )   Simplify the power first . = 240 Multiply .

Note that if the order of operations were not followed, the result would be incorrect:

f ( 3 ) = 30 ( 2 ) 3 60 3 = 216,000

Evaluating exponential functions

Let f ( x ) = 5 ( 3 ) x + 1 . Evaluate f ( 2 ) without using a calculator.

Follow the order of operations. Be sure to pay attention to the parentheses.

f ( x ) = 5 ( 3 ) x + 1 f ( 2 ) = 5 ( 3 ) 2 + 1 Substitute  x = 2. = 5 ( 3 ) 3 Add the exponents . = 5 ( 27 ) Simplify the power . = 135 Multiply .
Got questions? Get instant answers now!

Let f ( x ) = 8 ( 1.2 ) x 5 . Evaluate f ( 3 ) using a calculator. Round to four decimal places.

5.5556

Got questions? Get instant answers now!

Defining exponential growth

Because the output of exponential functions increases very rapidly, the term “exponential growth” is often used in everyday language to describe anything that grows or increases rapidly. However, exponential growth can be defined more precisely in a mathematical sense. If the growth rate is proportional to the amount present, the function models exponential growth.

Exponential growth

A function that models exponential growth    grows by a rate proportional to the amount present. For any real number x and any positive real numbers a   and b such that b 1 , an exponential growth function has the form

  f ( x ) = a b x

where

  • a is the initial or starting value of the function.
  • b is the growth factor or growth multiplier per unit x .

In more general terms, we have an exponential function , in which a constant base is raised to a variable exponent. To differentiate between linear and exponential functions, let’s consider two companies, A and B. Company A has 100 stores and expands by opening 50 new stores a year, so its growth can be represented by the function A ( x ) = 100 + 50 x . Company B has 100 stores and expands by increasing the number of stores by 50% each year, so its growth can be represented by the function B ( x ) = 100 ( 1 + 0.5 ) x .

A few years of growth for these companies are illustrated in [link] .

Year, x Stores, Company A Stores, Company B
0 100 + 50 ( 0 ) = 100 100 ( 1 + 0.5 ) 0 = 100
1 100 + 50 ( 1 ) = 150 100 ( 1 + 0.5 ) 1 = 150
2 100 + 50 ( 2 ) = 200 100 ( 1 + 0.5 ) 2 = 225
3 100 + 50 ( 3 ) = 250 100 ( 1 + 0.5 ) 3 = 337.5
x A ( x ) = 100 + 50 x B ( x ) = 100 ( 1 + 0.5 ) x

The graphs comparing the number of stores for each company over a five-year period are shown in [link] . We can see that, with exponential growth, the number of stores increases much more rapidly than with linear growth.

Graph of Companies A and B’s functions, which values are found in the previous table.
The graph shows the numbers of stores Companies A and B opened over a five-year period.

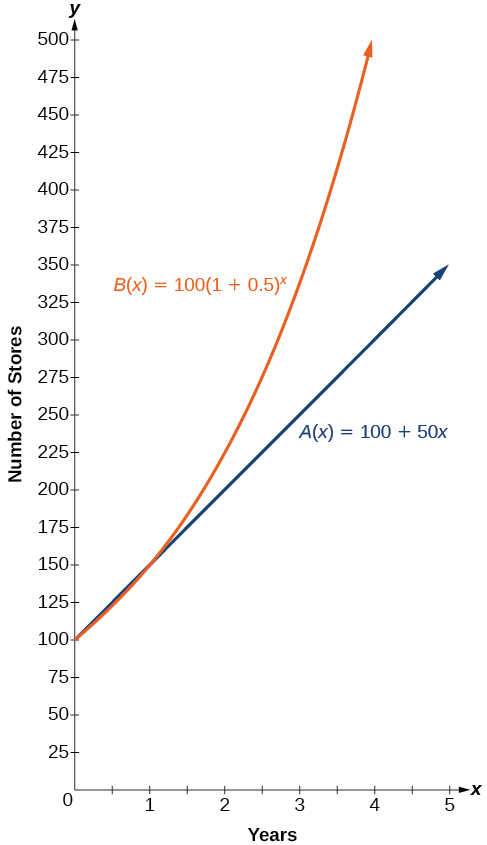
Notice that the domain for both functions is [ 0 , ) , and the range for both functions is [ 100 , ) . After year 1, Company B always has more stores than Company A.

Now we will turn our attention to the function representing the number of stores for Company B, B ( x ) = 100 ( 1 + 0.5 ) x . In this exponential function, 100 represents the initial number of stores, 0.50 represents the growth rate, and 1 + 0.5 = 1.5 represents the growth factor. Generalizing further, we can write this function as B ( x ) = 100 ( 1.5 ) x , where 100 is the initial value, 1.5 is called the base , and x is called the exponent .

Questions & Answers

how do you get the 2/50
Abba Reply
number of sport play by 50 student construct discrete data
Aminu Reply
width of the frangebany leaves on how to write a introduction
Theresa Reply
Solve the mean of variance
Veronica Reply
Step 1: Find the mean. To find the mean, add up all the scores, then divide them by the number of scores. ... Step 2: Find each score's deviation from the mean. ... Step 3: Square each deviation from the mean. ... Step 4: Find the sum of squares. ... Step 5: Divide the sum of squares by n – 1 or N.
kenneth
what is error
Yakuba Reply
Is mistake done to something
Vutshila
Hy
anas
hy
What is the life teble
anas
hy
Jibrin
statistics is the analyzing of data
Tajudeen Reply
what is statics?
Zelalem Reply
how do you calculate mean
Gloria Reply
diveving the sum if all values
Shaynaynay
let A1,A2 and A3 events be independent,show that (A1)^c, (A2)^c and (A3)^c are independent?
Fisaye Reply
what is statistics
Akhisani Reply
data collected all over the world
Shaynaynay
construct a less than and more than table
Imad Reply
The sample of 16 students is taken. The average age in the sample was 22 years with astandard deviation of 6 years. Construct a 95% confidence interval for the age of the population.
Aschalew Reply
Bhartdarshan' is an internet-based travel agency wherein customer can see videos of the cities they plant to visit. The number of hits daily is a normally distributed random variable with a mean of 10,000 and a standard deviation of 2,400 a. what is the probability of getting more than 12,000 hits? b. what is the probability of getting fewer than 9,000 hits?
Akshay Reply
Bhartdarshan'is an internet-based travel agency wherein customer can see videos of the cities they plan to visit. The number of hits daily is a normally distributed random variable with a mean of 10,000 and a standard deviation of 2,400. a. What is the probability of getting more than 12,000 hits
Akshay
1
Bright
Sorry i want to learn more about this question
Bright
Someone help
Bright
a= 0.20233 b=0.3384
Sufiyan
a
Shaynaynay
How do I interpret level of significance?
Mohd Reply
It depends on your business problem or in Machine Learning you could use ROC- AUC cruve to decide the threshold value
Shivam
how skewness and kurtosis are used in statistics
Owen Reply
yes what is it
Taneeya
Got questions? Join the online conversation and get instant answers!
Jobilize.com Reply
Practice Key Terms 4

Get Jobilize Job Search Mobile App in your pocket Now!

Get it on Google Play Download on the App Store Now


Source:  OpenStax, College algebra. OpenStax CNX. Feb 06, 2015 Download for free at https://legacy.cnx.org/content/col11759/1.3
Google Play and the Google Play logo are trademarks of Google Inc.

Notification Switch

Would you like to follow the 'College algebra' conversation and receive update notifications?

Ask