Given a tabular function, create a new row to represent a horizontal shift.
Identify the input row or column.
Determine the magnitude of the shift.
Add the shift to the value in each input cell.
Shifting a tabular function horizontally
A function
is given in
[link] . Create a table for the function
2
4
6
8
1
3
7
11
The formula
tells us that the output values of
are the same as the output value of
when the input value is 3 less than the original value. For example, we know that
To get the same output from the function
we will need an input value that is 3
larger . We input a value that is 3 larger for
because the function takes 3 away before evaluating the function
We continue with the other values to create
[link] .
5
7
9
11
2
4
6
8
1
3
7
11
1
3
7
11
The result is that the function
has been shifted to the right by 3. Notice the output values for
remain the same as the output values for
but the corresponding input values,
have shifted to the right by 3. Specifically, 2 shifted to 5, 4 shifted to 7, 6 shifted to 9, and 8 shifted to 11.
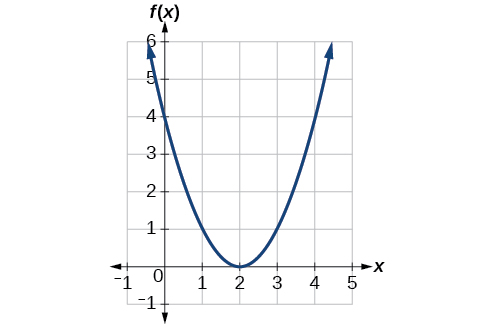
Identifying a horizontal shift of a toolkit function
[link] represents a transformation of the toolkit function
Relate this new function
to
and then find a formula for
Notice that the graph is identical in shape to the
function, but the
x- values are shifted to the right 2 units. The vertex used to be at (0,0), but now the vertex is at (2,0). The graph is the basic quadratic function shifted 2 units to the right, so
Notice how we must input the value
to get the output value
the
x -values must be 2 units larger because of the shift to the right by 2 units. We can then use the definition of the
function to write a formula for
by evaluating
The function
gives the number of gallons of gas required to drive
miles. Interpret
and
can be interpreted as adding 10 to the output, gallons. This is the gas required to drive
miles, plus another 10 gallons of gas. The graph would indicate a vertical shift.
can be interpreted as adding 10 to the input, miles. So this is the number of gallons of gas required to drive 10 miles more than
miles. The graph would indicate a horizontal shift.
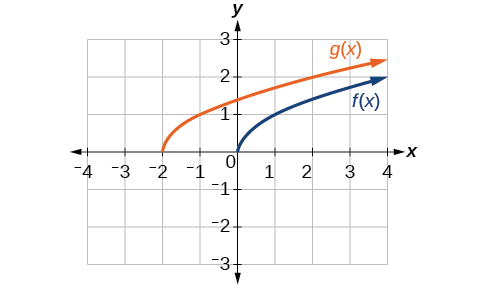
Given the function
graph the original function
and the transformation
on the same axes. Is this a horizontal or a vertical shift? Which way is the graph shifted and by how many units?
The graphs of
and
are shown below. The transformation is a horizontal shift. The function is shifted to the left by 2 units.
Now that we have two transformations, we can combine them. Vertical shifts are outside changes that affect the output (
y -) values and shift the function up or down. Horizontal shifts are inside changes that affect the input (
x -) values and shift the function left or right. Combining the two types of shifts will cause the graph of a function to shift up or down
and left or right.
Bacteria doesn't produce energy they are dependent upon their substrate in case of lack of nutrients they are able to make spores which helps them to sustain in harsh environments
_Adnan
But not all bacteria make spores, l mean Eukaryotic cells have Mitochondria which acts as powerhouse for them, since bacteria don't have it, what is the substitution for it?
Assimilatory nitrate reduction is a process that occurs in some microorganisms, such as bacteria and archaea, in which nitrate (NO3-) is reduced to nitrite (NO2-), and then further reduced to ammonia (NH3).
Elkana
This process is called assimilatory nitrate reduction because the nitrogen that is produced is incorporated in the cells of microorganisms where it can be used in the synthesis of amino acids and other nitrogen products
There are nothing like emergency disease but there are some common medical emergency which can occur simultaneously like Bleeding,heart attack,Breathing difficulties,severe pain heart stock.Hope you will get my point .Have a nice day ❣️
_Adnan
define infection ,prevention and control
Innocent
I think infection prevention and control is the avoidance of all things we do that gives out break of infections and promotion of health practices that promote life