<< Chapter < Page Chapter >> Page >

Using a regression line to make predictions

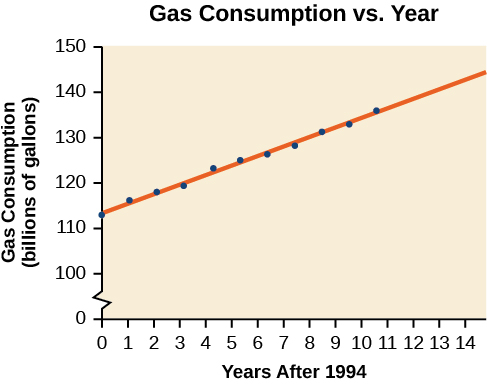
Gasoline consumption in the United States has been steadily increasing. Consumption data from 1994 to 2004 is shown in [link] . http://www.bts.gov/publications/national_transportation_statistics/2005/html/table_04_10.html Determine whether the trend is linear, and if so, find a model for the data. Use the model to predict the consumption in 2008.

Year '94 '95 '96 '97 '98 '99 '00 '01 '02 '03 '04
Consumption (billions of gallons) 113 116 118 119 123 125 126 128 131 133 136

The scatter plot of the data, including the least squares regression line, is shown in [link] .

Scatter plot, showing the line of best fit. It is titled 'Gas Consumption VS Year'. The x-axis is 'Year After 1994', and the y-axis is 'Gas Consumption (billions of gallons)'. The points are strongly positively correlated and the line of best fit goes through most of the points completely.

We can introduce new input variable, t , representing years since 1994.

The least squares regression equation is:

C ( t ) = 113.318 + 2.209 t

Using technology, the correlation coefficient was calculated to be 0.9965, suggesting a very strong increasing linear trend.

Using this to predict consumption in 2008 ( t = 14 ) ,

C ( 14 ) = 113.318 + 2.209 ( 14 )           = 144.244

The model predicts 144.244 billion gallons of gasoline consumption in 2008.

Got questions? Get instant answers now!

Use the model we created using technology in [link] to predict the gas consumption in 2011. Is this an interpolation or an extrapolation?

150.871 billion gallons; extrapolation

Got questions? Get instant answers now!

Access these online resources for additional instruction and practice with fitting linear models to data.

Key concepts

  • Scatter plots show the relationship between two sets of data. See [link] .
  • Scatter plots may represent linear or non-linear models.
  • The line of best fit may be estimated or calculated, using a calculator or statistical software. See [link] .
  • Interpolation can be used to predict values inside the domain and range of the data, whereas extrapolation can be used to predict values outside the domain and range of the data. See [link] .
  • The correlation coefficient, r , indicates the degree of linear relationship between data. See [link] .
  • A regression line best fits the data. See [link] .
  • The least squares regression line is found by minimizing the squares of the distances of points from a line passing through the data and may be used to make predictions regarding either of the variables. See [link] .

Section exercises

Verbal

Describe what it means if there is a model breakdown when using a linear model.

When our model no longer applies, after some value in the domain, the model itself doesn’t hold.

Got questions? Get instant answers now!

What is interpolation when using a linear model?

Got questions? Get instant answers now!

What is extrapolation when using a linear model?

We predict a value outside the domain and range of the data.

Got questions? Get instant answers now!

Explain the difference between a positive and a negative correlation coefficient.

Got questions? Get instant answers now!

Explain how to interpret the absolute value of a correlation coefficient.

The closer the number is to 1, the less scattered the data, the closer the number is to 0, the more scattered the data.

Got questions? Get instant answers now!

Algebraic

A regression was run to determine whether there is a relationship between hours of TV watched per day ( x ) and number of sit-ups a person can do ( y ) . The results of the regression are given below. Use this to predict the number of sit-ups a person who watches 11 hours of TV can do.

y = a x + b a = −1.341 b = 32.234   r = −0.896
Got questions? Get instant answers now!

Questions & Answers

what is biology
Hajah Reply
the study of living organisms and their interactions with one another and their environments
AI-Robot
what is biology
Victoria Reply
HOW CAN MAN ORGAN FUNCTION
Alfred Reply
the diagram of the digestive system
Assiatu Reply
allimentary cannel
Ogenrwot
How does twins formed
William Reply
They formed in two ways first when one sperm and one egg are splited by mitosis or two sperm and two eggs join together
Oluwatobi
what is genetics
Josephine Reply
Genetics is the study of heredity
Misack
how does twins formed?
Misack
What is manual
Hassan Reply
discuss biological phenomenon and provide pieces of evidence to show that it was responsible for the formation of eukaryotic organelles
Joseph Reply
what is biology
Yousuf Reply
the study of living organisms and their interactions with one another and their environment.
Wine
discuss the biological phenomenon and provide pieces of evidence to show that it was responsible for the formation of eukaryotic organelles in an essay form
Joseph Reply
what is the blood cells
Shaker Reply
list any five characteristics of the blood cells
Shaker
lack electricity and its more savely than electronic microscope because its naturally by using of light
Abdullahi Reply
advantage of electronic microscope is easily and clearly while disadvantage is dangerous because its electronic. advantage of light microscope is savely and naturally by sun while disadvantage is not easily,means its not sharp and not clear
Abdullahi
cell theory state that every organisms composed of one or more cell,cell is the basic unit of life
Abdullahi
is like gone fail us
DENG
cells is the basic structure and functions of all living things
Ramadan
What is classification
ISCONT Reply
is organisms that are similar into groups called tara
Yamosa
in what situation (s) would be the use of a scanning electron microscope be ideal and why?
Kenna Reply
A scanning electron microscope (SEM) is ideal for situations requiring high-resolution imaging of surfaces. It is commonly used in materials science, biology, and geology to examine the topography and composition of samples at a nanoscale level. SEM is particularly useful for studying fine details,
Hilary
cell is the building block of life.
Condoleezza Reply
Got questions? Join the online conversation and get instant answers!
Jobilize.com Reply
Practice Key Terms 5

Get Jobilize Job Search Mobile App in your pocket Now!

Get it on Google Play Download on the App Store Now


Source:  OpenStax, College algebra. OpenStax CNX. Feb 06, 2015 Download for free at https://legacy.cnx.org/content/col11759/1.3
Google Play and the Google Play logo are trademarks of Google Inc.

Notification Switch

Would you like to follow the 'College algebra' conversation and receive update notifications?

Ask