Because
r is significant and the scatter plot shows a linear trend, the regression line can be used to predict final exam scores.
Method 2: using a table of critical values to make a decision
The
95% Critical Values of the Sample Correlation Coefficient Table can be used to give you a good idea of whether the computed value of
is significant or not . Compare
r to the appropriate critical value in the table. If
r is not between the positive and negative critical values, then the correlation coefficient is significant. If
r is significant, then you may want to use the line for prediction.
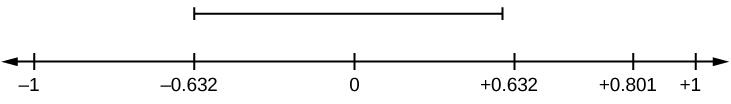
Suppose you computed
r = 0.801 using
n = 10 data points.
df =
n - 2 = 10 - 2 = 8. The critical values associated with
df = 8 are -0.632 and + 0.632. If
r <negative critical value or
r >positive critical value, then
r issignificant. Since
r = 0.801 and 0.801>0.632,
r is significant and the line may be usedfor prediction. If you view this example on a number line, it will help you.
r is not significant between -0.632 and +0.632.
r = 0.801>+0.632. Therefore,
r is significant.
For a given line of best fit, you computed that
r = 0.6501 using
n = 12 data points and the critical value is 0.576. Can the line be used for prediction? Why or why not?
If the scatter plot looks linear then, yes, the line can be used for prediction, because
r >the positive critical value.
Suppose you computed
r = –0.624 with 14 data points.
df = 14 – 2 = 12. The critical values are –0.532 and 0.532. Since –0.624<–0.532,
r is significant and the line can be used for prediction
For a given line of best fit, you compute that
r = 0.5204 using
n = 9 data points, and the critical value is 0.666. Can the line be used for prediction? Why or why not?
No, the line cannot be used for prediction, because
r <the positive critical value.
Suppose you computed
r = 0.776 and
n = 6.
df = 6 – 2 = 4. The critical values are –0.811 and 0.811. Since –0.811<0.776<0.811,
r is not significant, and the line should not be used for prediction.
-0.811<
r = 0.776<0.811. Therefore,
r is not significant.
For a given line of best fit, you compute that
r = –0.7204 using
n = 8 data points, and the critical value is = 0.707. Can the line be used for prediction? Why or why not?
Yes, the line can be used for prediction, because r<the negative critical value.
Third-exam vs final-exam example: critical value method
Consider the
third exam/final exam example .
The line of best fit is:
ŷ = –173.51+4.83
x with
r = 0.6631 and there are
n = 11 data points. Can the regression line be used for prediction?
Given a third-exam score (
x value), can we use the line to predict the final exam score (predicted
y value)?
H
0 :
ρ = 0
H
a :
ρ ≠ 0
α = 0.05
Use the "95% Critical Value" table for
r with
df =
n – 2 = 11 – 2 = 9.
The critical values are –0.602 and +0.602
Since 0.6631>0.602,
r is significant.
Decision: Reject the null hypothesis.
Conclusion:There is sufficient evidence to conclude that there is a significant linear relationship between the third exam score (
x ) and the final exam score (
y ) because the correlation coefficient is significantly different from zero.
Questions & Answers
A golfer on a fairway is 70 m away from the green, which sits below the level of the fairway by 20 m. If the golfer hits the ball at an angle of 40° with an initial speed of 20 m/s, how close to the green does she come?
A mouse of mass 200 g falls 100 m down a vertical mine shaft and lands at the bottom with a speed of 8.0 m/s. During its fall, how much work is done on the mouse by air resistance
Chemistry is a branch of science that deals with the study of matter,it composition,it structure and the changes it undergoes
Adjei
please, I'm a physics student and I need help in physics
Adjanou
chemistry could also be understood like the sexual attraction/repulsion of the male and female elements. the reaction varies depending on the energy differences of each given gender. + masculine -female.
Pedro
A ball is thrown straight up.it passes a 2.0m high window 7.50 m off the ground on it path up and takes 1.30 s to go past the window.what was the ball initial velocity
2. A sled plus passenger with total mass 50 kg is pulled 20 m across the snow (0.20) at constant velocity by a force directed 25° above the horizontal. Calculate (a) the work of the applied force, (b) the work of friction, and (c) the total work.
you have been hired as an espert witness in a court case involving an automobile accident. the accident involved car A of mass 1500kg which crashed into stationary car B of mass 1100kg. the driver of car A applied his brakes 15 m before he skidded and crashed into car B. after the collision, car A s
can someone explain to me, an ignorant high school student, why the trend of the graph doesn't follow the fact that the higher frequency a sound wave is, the more power it is, hence, making me think the phons output would follow this general trend?
Nevermind i just realied that the graph is the phons output for a person with normal hearing and not just the phons output of the sound waves power, I should read the entire thing next time
Joseph
Follow up question, does anyone know where I can find a graph that accuretly depicts the actual relative "power" output of sound over its frequency instead of just humans hearing
Joseph
"Generation of electrical energy from sound energy | IEEE Conference Publication | IEEE Xplore" ***ieeexplore.ieee.org/document/7150687?reload=true
A string is 3.00 m long with a mass of 5.00 g. The string is held taut with a tension of 500.00 N applied to the string. A pulse is sent down the string. How long does it take the pulse to travel the 3.00 m of the string?