<< Chapter < Page Chapter >> Page >

Evaluating a real-world exponential model

At the beginning of this section, we learned that the population of India was about 1.25 billion in the year 2013, with an annual growth rate of about 1.2 % . This situation is represented by the growth function P ( t ) = 1.25 ( 1.012 ) t , where t is the number of years since 2013. To the nearest thousandth, what will the population of India be in 2031?

To estimate the population in 2031, we evaluate the models for t = 18 , because 2031 is 18 years after 2013. Rounding to the nearest thousandth,

P ( 18 ) = 1.25 ( 1.012 ) 18 1.549

There will be about 1.549 billion people in India in the year 2031.

Got questions? Get instant answers now!

The population of China was about 1.39 billion in the year 2013, with an annual growth rate of about 0.6 % . This situation is represented by the growth function P ( t ) = 1.39 ( 1.006 ) t , where t is the number of years since 2013. To the nearest thousandth, what will the population of China be for the year 2031? How does this compare to the population prediction we made for India in [link] ?

About 1.548 billion people; by the year 2031, India’s population will exceed China’s by about 0.001 billion, or 1 million people.

Got questions? Get instant answers now!

Finding equations of exponential functions

In the previous examples, we were given an exponential function, which we then evaluated for a given input. Sometimes we are given information about an exponential function without knowing the function explicitly. We must use the information to first write the form of the function, then determine the constants a and b , and evaluate the function.

Given two data points, write an exponential model.

  1. If one of the data points has the form ( 0 , a ) , then a is the initial value. Using a , substitute the second point into the equation f ( x ) = a ( b ) x , and solve for b .
  2. If neither of the data points have the form ( 0 , a ) , substitute both points into two equations with the form f ( x ) = a ( b ) x . Solve the resulting system of two equations in two unknowns to find a and b .
  3. Using the a and b found in the steps above, write the exponential function in the form f ( x ) = a ( b ) x .

Writing an exponential model when the initial value is known

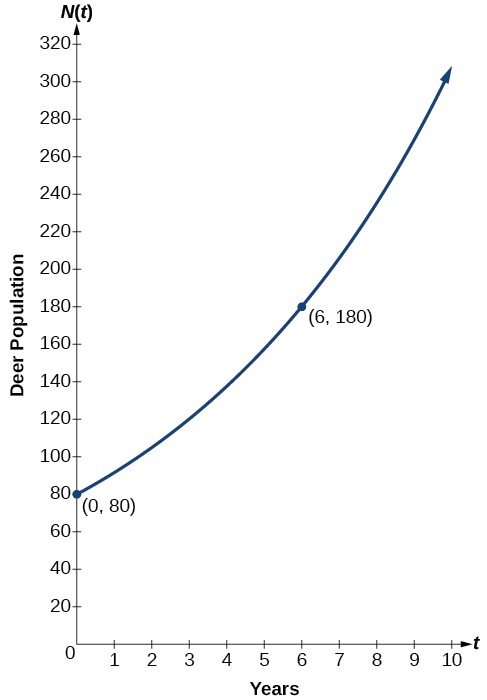
In 2006, 80 deer were introduced into a wildlife refuge. By 2012, the population had grown to 180 deer. The population was growing exponentially. Write an algebraic function N ( t ) representing the population ( N ) of deer over time t .

We let our independent variable t be the number of years after 2006. Thus, the information given in the problem can be written as input-output pairs: (0, 80) and (6, 180). Notice that by choosing our input variable to be measured as years after 2006, we have given ourselves the initial value for the function, a = 80. We can now substitute the second point into the equation N ( t ) = 80 b t to find b :

N ( t ) = 80 b t 180 = 80 b 6 Substitute using point  ( 6 ,   180 ) . 9 4 = b 6 Divide and write in lowest terms . b = ( 9 4 ) 1 6 Isolate  b  using properties of exponents . b 1.1447 Round to 4 decimal places .

NOTE: Unless otherwise stated, do not round any intermediate calculations. Then round the final answer to four places for the remainder of this section.

The exponential model for the population of deer is N ( t ) = 80 ( 1.1447 ) t . (Note that this exponential function models short-term growth. As the inputs gets large, the output will get increasingly larger, so much so that the model may not be useful in the long term.)

We can graph our model to observe the population growth of deer in the refuge over time. Notice that the graph in [link] passes through the initial points given in the problem, ( 0 ,  8 0 ) and ( 6 ,  18 0 ) . We can also see that the domain for the function is [ 0 , ) , and the range for the function is [ 80 , ) .

Graph of the exponential function, N(t) = 80(1.1447)^t, with labeled points at (0, 80) and (6, 180).
Graph showing the population of deer over time, N ( t ) = 80 ( 1.1447 ) t , t years after 2006
Got questions? Get instant answers now!

Questions & Answers

what does mean opportunity cost?
Aster Reply
what is poetive effect of population growth
Solomon Reply
what is inflation
Nasir Reply
what is demand
Eleni
what is economics
IMLAN Reply
economics theory describes individual behavior as the result of a process of optimization under constraints the objective to be reached being determined by
Kalkidan
Economics is a branch of social science that deal with How to wise use of resource ,s
Kassie
need
WARKISA
Economic Needs: In economics, needs are goods or services that are necessary for maintaining a certain standard of living. This includes things like healthcare, education, and transportation.
Kalkidan
What is demand and supply
EMPEROR Reply
deman means?
Alex
what is supply?
Alex
ex play supply?
Alex
Money market is a branch or segment of financial market where short-term debt instruments are traded upon. The instruments in this market includes Treasury bills, Bonds, Commercial Papers, Call money among other.
murana Reply
good
Kayode
what is money market
umar Reply
Examine the distinction between theory of comparative cost Advantage and theory of factor proportion
Fatima Reply
What is inflation
Bright Reply
a general and ongoing rise in the level of prices in an economy
AI-Robot
What are the factors that affect demand for a commodity
Florence Reply
price
Kenu
differentiate between demand and supply giving examples
Lambiv Reply
differentiated between demand and supply using examples
Lambiv
what is labour ?
Lambiv
how will I do?
Venny Reply
how is the graph works?I don't fully understand
Rezat Reply
information
Eliyee
devaluation
Eliyee
t
WARKISA
hi guys good evening to all
Lambiv
multiple choice question
Aster Reply
appreciation
Eliyee
explain perfect market
Lindiwe Reply
In economics, a perfect market refers to a theoretical construct where all participants have perfect information, goods are homogenous, there are no barriers to entry or exit, and prices are determined solely by supply and demand. It's an idealized model used for analysis,
Ezea
Got questions? Join the online conversation and get instant answers!
Jobilize.com Reply
Practice Key Terms 4

Get Jobilize Job Search Mobile App in your pocket Now!

Get it on Google Play Download on the App Store Now


Source:  OpenStax, Precalculus. OpenStax CNX. Jan 19, 2016 Download for free at https://legacy.cnx.org/content/col11667/1.6
Google Play and the Google Play logo are trademarks of Google Inc.

Notification Switch

Would you like to follow the 'Precalculus' conversation and receive update notifications?

Ask