<< Chapter < Page Chapter >> Page >
Spectrograms visually represent the speach signal, and the calculation of the Spectrogram is briefly explained.

We know how to acquire analog signals for digital processing ( pre-filtering , sampling , and A/D conversion ) and to compute spectra of discrete-time signals (using the FFT algorithm ), let's put these various components together to learn how the spectrogram shown in [link] , which is used to analyze speech , is calculated. The speech was sampled at a rate of 11.025 kHzand passed through a 16-bit A/D converter.

Music compact discs (CDs) encode their signals at a sampling rate of 44.1 kHz. We'll learn the rationale for thisnumber later. The 11.025 kHz sampling rate for the speech is 1/4 of the CD sampling rate, and was the lowest availablesampling rate commensurate with speech signal bandwidths available on my computer.

Looking at [link] the signal lasted a little over 1.2 seconds. How long was thesampled signal (in terms of samples)? What was the datarate during the sampling process in bps (bits per second)?Assuming the computer storage is organized in terms of bytes (8-bit quantities), how many bytes of computer memory doesthe speech consume?

Number of samples equals 1.2 11025 13230 . The datarate is 11025 16 176.4 kbps. The storage required would be 26460 bytes.

Got questions? Get instant answers now!

Speech spectrogram

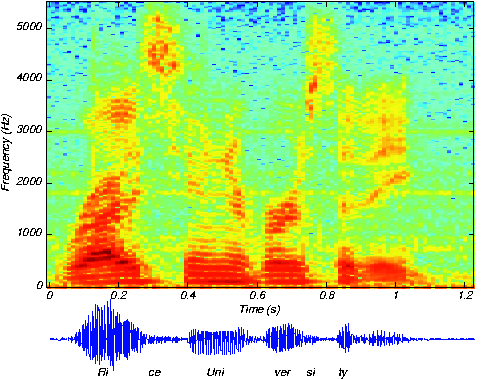
The resulting discrete-time signal, shown in the bottom of [link] , clearly changes its character with time. To display these spectral changes, thelong signal was sectioned into frames : comparatively short, contiguous groups of samples.Conceptually, a Fourier transform of each frame is calculated using the FFT. Each frame is not so long that significantsignal variations are retained within a frame, but not so short that we lose the signal's spectral character. Roughly speaking, the speech signal's spectrum is evaluated over successive time segments and stacked side by side so that the x -axis corresponds to time and the y -axis frequency, with color indicating the spectral amplitude.

An important detail emerges when we examine each framed signal ( [link] ).

Spectrogram hanning vs. rectangular

The top waveform is a segment 1024 samples long taken from the beginning of the "Rice University" phrase. Computing [link] involved creating frames, here demarked by the vertical lines, that were 256 sampleslong and finding the spectrum of each. If a rectangular window is applied (corresponding to extracting a frame fromthe signal), oscillations appear in the spectrum (middle of bottom row). Applying a Hanning window gracefully tapers thesignal toward frame edges, thereby yielding a more accurate computation of the signal's spectrum at that moment of time.
At the frame's edges, the signal may change very abruptly, a feature not present in theoriginal signal. A transform of such a segment reveals a curious oscillation in the spectrum, an artifact directlyrelated to this sharp amplitude change. A better way to frame signals for spectrograms is to apply a window : Shape the signal values within a frame so that the signal decaysgracefully as it nears the edges. This shaping is accomplished by multiplying the framed signal by the sequence w n . In sectioning the signal, we essentially applied a rectangular window: w n 1 , 0 n N 1 . A much more graceful window is the Hanning window ; it has the cosine shape w n 1 2 1 2 n N . As shown in [link] , this shaping greatly reduces spurious oscillations in each frame'sspectrum. Considering the spectrum of the Hanning windowed frame, we find that the oscillations resulting from applying therectangular window obscured a formant (the one located at a little more than half the Nyquist frequency).

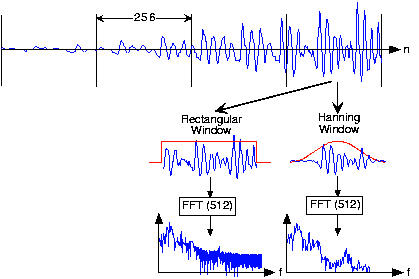
What might be the source of these oscillations? To gain some insight, what is thelength- 2 N discrete Fourier transform of a length- N pulse? The pulse emulates the rectangular window, and certainly has edges.Compare your answer with the length- 2 N transform of alength- N Hanning window.

The oscillations are due to the boxcar window's Fourier transform, which equals the sinc function.

Got questions? Get instant answers now!

Non-overlapping windows

In comparison with the original speech segment shown in the upper plot, the non-overlapped Hanning windowed version shownbelow it is very ragged. Clearly, spectral information extracted from the bottom plot could well miss importantfeatures present in the original.

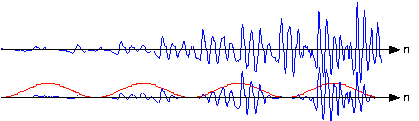
If you examine the windowed signal sections in sequence to examine windowing's effect on signal amplitude, we see that wehave managed to amplitude-modulate the signal with the periodically repeated window ( [link] ). To alleviate this problem, frames are overlapped (typically by half a frame duration). This solutionrequires more Fourier transform calculations than needed by rectangular windowing, but the spectra are much better behavedand spectral changes are much better captured.

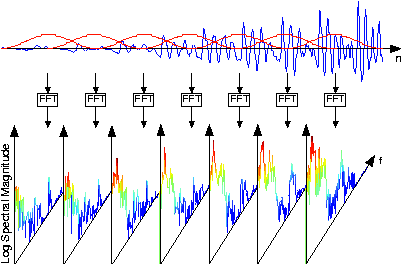
The speech signal, such as shown in the speech spectrogram , is sectioned into overlapping, equal-length frames, with a Hanning window appliedto each frame. The spectra of each of these is calculated, and displayed in spectrograms with frequency extending vertically,window time location running horizontally, and spectral magnitude color-coded. [link] illustrates these computations.

Overlapping windows for computing spectrograms

The original speech segment and the sequence of overlapping Hanning windows applied to it are shown in the upper portion.Frames were 256 samples long and a Hanning window was applied with a half-frame overlap. A length-512 FFT of each frame wascomputed, with the magnitude of the first 257 FFT values displayed vertically, with spectral amplitude valuescolor-coded.

Why the specific values of 256 for N and 512 for K ? Another issue is how was the length-512 transform of each length-256 windowed framecomputed?

These numbers are powers-of-two, and the FFT algorithm can be exploited with these lengths. To compute a longertransform than the input signal's duration, we simply zero-pad the signal.

Got questions? Get instant answers now!

Questions & Answers

A golfer on a fairway is 70 m away from the green, which sits below the level of the fairway by 20 m. If the golfer hits the ball at an angle of 40° with an initial speed of 20 m/s, how close to the green does she come?
Aislinn Reply
cm
tijani
what is titration
John Reply
what is physics
Siyaka Reply
A mouse of mass 200 g falls 100 m down a vertical mine shaft and lands at the bottom with a speed of 8.0 m/s. During its fall, how much work is done on the mouse by air resistance
Jude Reply
Can you compute that for me. Ty
Jude
what is the dimension formula of energy?
David Reply
what is viscosity?
David
what is inorganic
emma Reply
what is chemistry
Youesf Reply
what is inorganic
emma
Chemistry is a branch of science that deals with the study of matter,it composition,it structure and the changes it undergoes
Adjei
please, I'm a physics student and I need help in physics
Adjanou
chemistry could also be understood like the sexual attraction/repulsion of the male and female elements. the reaction varies depending on the energy differences of each given gender. + masculine -female.
Pedro
A ball is thrown straight up.it passes a 2.0m high window 7.50 m off the ground on it path up and takes 1.30 s to go past the window.what was the ball initial velocity
Krampah Reply
2. A sled plus passenger with total mass 50 kg is pulled 20 m across the snow (0.20) at constant velocity by a force directed 25° above the horizontal. Calculate (a) the work of the applied force, (b) the work of friction, and (c) the total work.
Sahid Reply
you have been hired as an espert witness in a court case involving an automobile accident. the accident involved car A of mass 1500kg which crashed into stationary car B of mass 1100kg. the driver of car A applied his brakes 15 m before he skidded and crashed into car B. after the collision, car A s
Samuel Reply
can someone explain to me, an ignorant high school student, why the trend of the graph doesn't follow the fact that the higher frequency a sound wave is, the more power it is, hence, making me think the phons output would follow this general trend?
Joseph Reply
Nevermind i just realied that the graph is the phons output for a person with normal hearing and not just the phons output of the sound waves power, I should read the entire thing next time
Joseph
Follow up question, does anyone know where I can find a graph that accuretly depicts the actual relative "power" output of sound over its frequency instead of just humans hearing
Joseph
"Generation of electrical energy from sound energy | IEEE Conference Publication | IEEE Xplore" ***ieeexplore.ieee.org/document/7150687?reload=true
Ryan
what's motion
Maurice Reply
what are the types of wave
Maurice
answer
Magreth
progressive wave
Magreth
hello friend how are you
Muhammad Reply
fine, how about you?
Mohammed
hi
Mujahid
A string is 3.00 m long with a mass of 5.00 g. The string is held taut with a tension of 500.00 N applied to the string. A pulse is sent down the string. How long does it take the pulse to travel the 3.00 m of the string?
yasuo Reply
Who can show me the full solution in this problem?
Reofrir Reply
Got questions? Join the online conversation and get instant answers!
Jobilize.com Reply

Get Jobilize Job Search Mobile App in your pocket Now!

Get it on Google Play Download on the App Store Now


Source:  OpenStax, Fundamentals of electrical engineering i. OpenStax CNX. Aug 06, 2008 Download for free at http://legacy.cnx.org/content/col10040/1.9
Google Play and the Google Play logo are trademarks of Google Inc.

Notification Switch

Would you like to follow the 'Fundamentals of electrical engineering i' conversation and receive update notifications?

Ask