<< Chapter < Page Chapter >> Page >
D ( t ) = 83 t + 250

Representing a linear function in tabular form

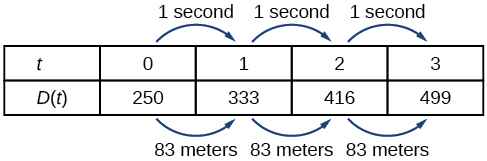
A third method of representing a linear function is through the use of a table. The relationship between the distance from the station and the time is represented in [link] . From the table, we can see that the distance changes by 83 meters for every 1 second increase in time.

Table with the first row, labeled t, containing the seconds from 0, 1, 2, 3, and with the second row, labeled D (t), containing the meters 250, 333, 416, and 499. Each value in the first row increases by 1 second, and each value in the second row increases by 83 meters.
Tabular representation of the function D showing selected input and output values

Can the input in the previous example be any real number?

No. The input represents time so while nonnegative rational and irrational numbers are possible, negative real numbers are not possible for this example. The input consists of non-negative real numbers.

Representing a linear function in graphical form

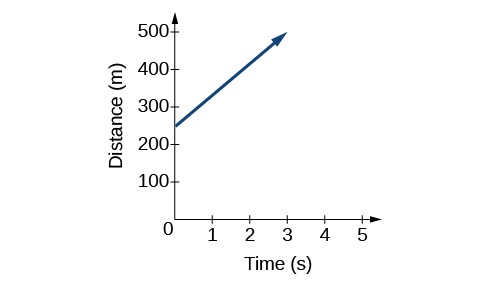
Another way to represent linear functions is visually, using a graph. We can use the function relationship from above, D ( t ) = 83 t + 250 , to draw a graph as represented in [link] . Notice the graph is a line . When we plot a linear function, the graph is always a line.

The rate of change, which is constant, determines the slant, or slope    of the line. The point at which the input value is zero is the vertical intercept, or y -intercept    , of the line. We can see from the graph that the y -intercept in the train example we just saw is ( 0 , 250 ) and represents the distance of the train from the station when it began moving at a constant speed.

This is a graph with y-axis labeled “Distance (m)” and x-axis labeled “Time (s).” The x-axis spans from 0 to 5 and is marked in increments of one. The y-axis spans from 0 to 500 and is marked in increments of one hundred. The graph shows an increasing function. As time increases, distance also increases. The line is graphed along the points (0, 250) and (1, 333)
The graph of D ( t ) = 83 t + 250 . Graphs of linear functions are lines because the rate of change is constant.

Notice that the graph of the train example is restricted, but this is not always the case. Consider the graph of the line f ( x ) = 2 x + 1. Ask yourself what numbers can be input to the function. In other words, what is the domain of the function? The domain is comprised of all real numbers because any number may be doubled, and then have one added to the product.

Linear function

A linear function    is a function whose graph is a line. Linear functions can be written in the slope-intercept form    of a line

f ( x ) = m x + b

where b is the initial or starting value of the function (when input, x = 0 ), and m is the constant rate of change, or slope of the function. The y -intercept is at ( 0 , b ) .

Using a linear function to find the pressure on a diver

The pressure, P , in pounds per square inch (PSI) on the diver in [link] depends upon her depth below the water surface, d , in feet. This relationship may be modeled by the equation, P ( d ) = 0.434 d + 14.696. Restate this function in words.

This figure shows a scuba diver.
(credit: Ilse Reijs and Jan-Noud Hutten)

To restate the function in words, we need to describe each part of the equation. The pressure as a function of depth equals four hundred thirty-four thousandths times depth plus fourteen and six hundred ninety-six thousandths.

Got questions? Get instant answers now!

Determining whether a linear function is increasing, decreasing, or constant

The linear functions we used in the two previous examples increased over time, but not every linear function does. A linear function may be increasing, decreasing, or constant. For an increasing function    , as with the train example, the output values increase as the input values increase. The graph of an increasing function has a positive slope. A line with a positive slope slants upward from left to right as in [link] (a) . For a decreasing function    , the slope is negative. The output values decrease as the input values increase. A line with a negative slope slants downward from left to right as in [link] (b) . If the function is constant, the output values are the same for all input values so the slope is zero. A line with a slope of zero is horizontal as in [link] (c) .

Questions & Answers

what does mean opportunity cost?
Aster Reply
what is poetive effect of population growth
Solomon Reply
what is inflation
Nasir Reply
what is demand
Eleni
what is economics
IMLAN Reply
economics theory describes individual behavior as the result of a process of optimization under constraints the objective to be reached being determined by
Kalkidan
Economics is a branch of social science that deal with How to wise use of resource ,s
Kassie
need
WARKISA
Economic Needs: In economics, needs are goods or services that are necessary for maintaining a certain standard of living. This includes things like healthcare, education, and transportation.
Kalkidan
What is demand and supply
EMPEROR Reply
deman means?
Alex
what is supply?
Alex
ex play supply?
Alex
Money market is a branch or segment of financial market where short-term debt instruments are traded upon. The instruments in this market includes Treasury bills, Bonds, Commercial Papers, Call money among other.
murana Reply
good
Kayode
what is money market
umar Reply
Examine the distinction between theory of comparative cost Advantage and theory of factor proportion
Fatima Reply
What is inflation
Bright Reply
a general and ongoing rise in the level of prices in an economy
AI-Robot
What are the factors that affect demand for a commodity
Florence Reply
price
Kenu
differentiate between demand and supply giving examples
Lambiv Reply
differentiated between demand and supply using examples
Lambiv
what is labour ?
Lambiv
how will I do?
Venny Reply
how is the graph works?I don't fully understand
Rezat Reply
information
Eliyee
devaluation
Eliyee
t
WARKISA
hi guys good evening to all
Lambiv
multiple choice question
Aster Reply
appreciation
Eliyee
explain perfect market
Lindiwe Reply
In economics, a perfect market refers to a theoretical construct where all participants have perfect information, goods are homogenous, there are no barriers to entry or exit, and prices are determined solely by supply and demand. It's an idealized model used for analysis,
Ezea
Got questions? Join the online conversation and get instant answers!
Jobilize.com Reply

Get Jobilize Job Search Mobile App in your pocket Now!

Get it on Google Play Download on the App Store Now


Source:  OpenStax, College algebra. OpenStax CNX. Feb 06, 2015 Download for free at https://legacy.cnx.org/content/col11759/1.3
Google Play and the Google Play logo are trademarks of Google Inc.

Notification Switch

Would you like to follow the 'College algebra' conversation and receive update notifications?

Ask